29
/
en
AIzaSyAYiBZKx7MnpbEhh9jyipgxe19OcubqV5w
April 1, 2024
129850
Estonia
EST
true
2
1
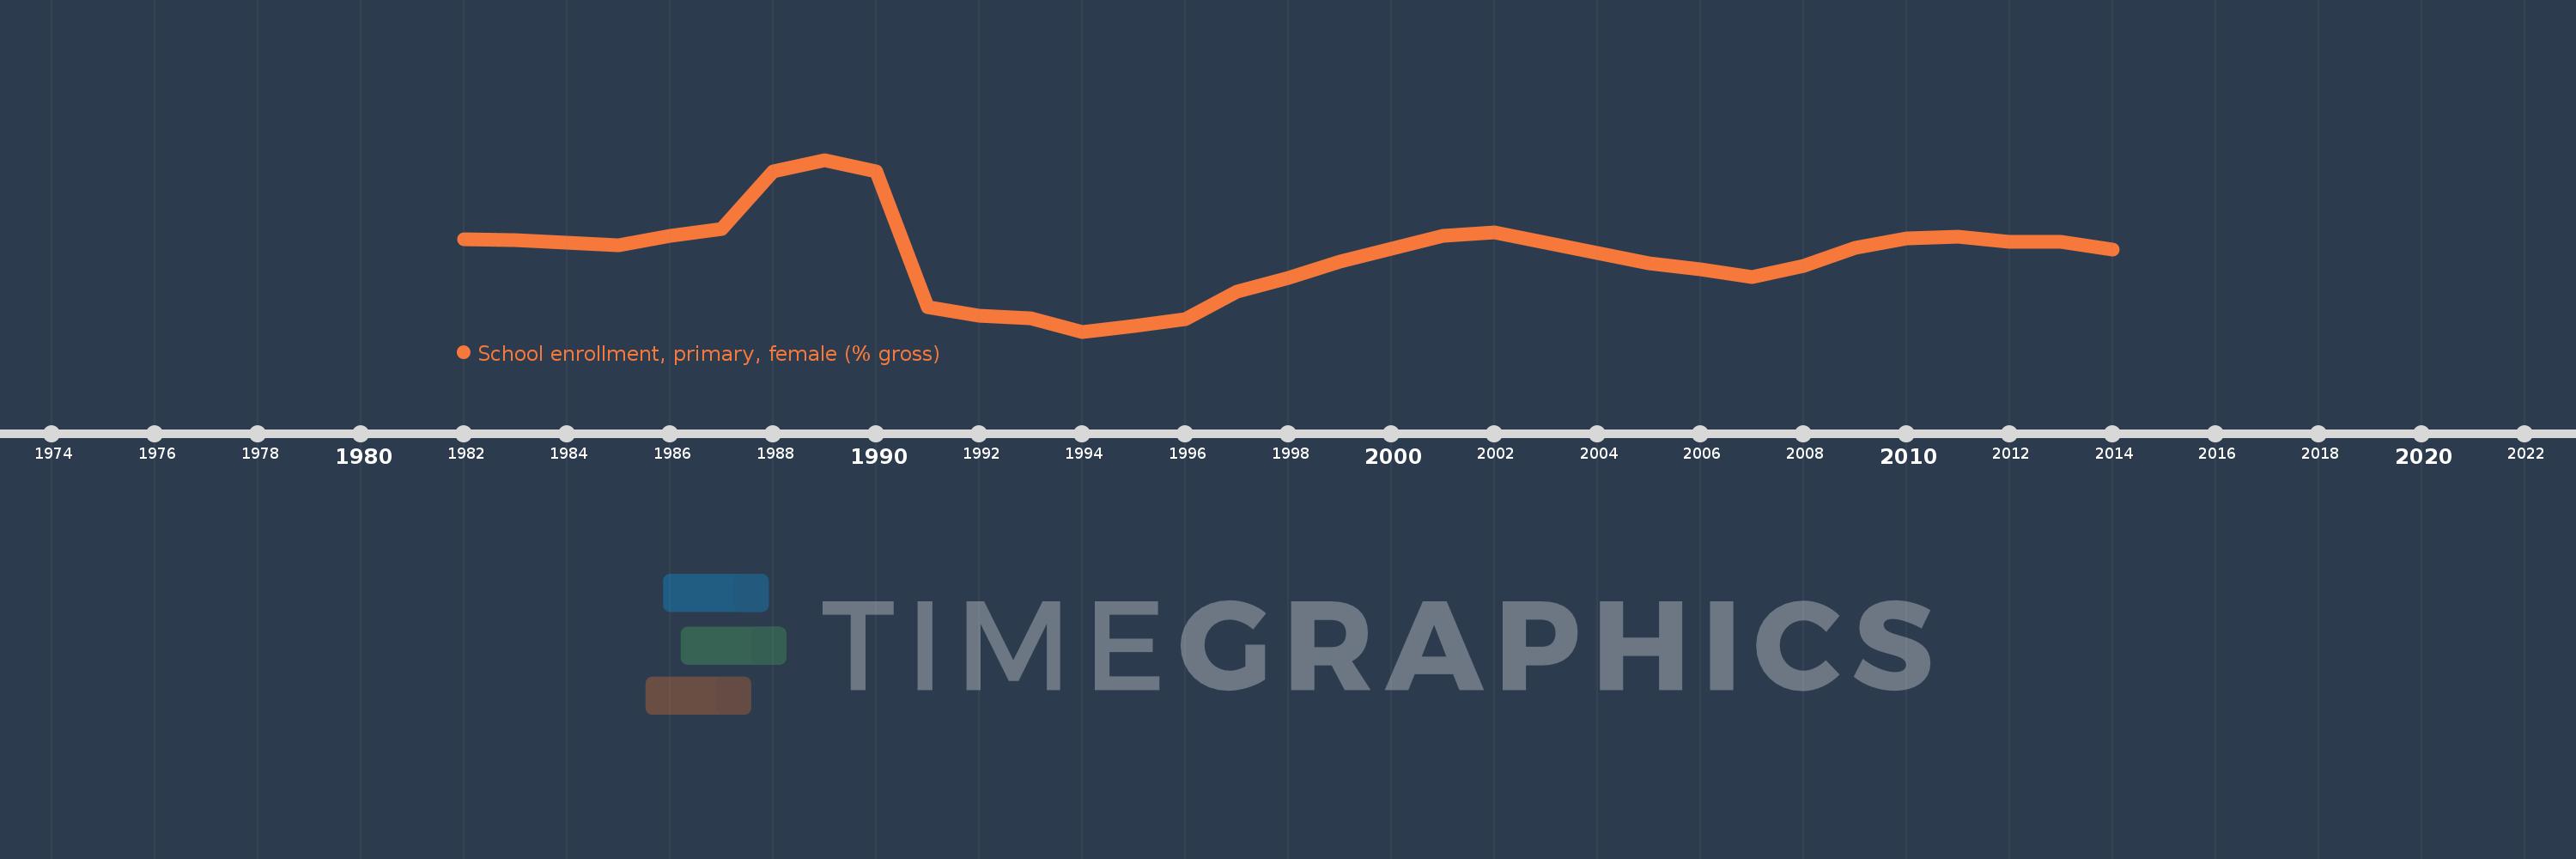
School enrollment, primary, female (% gross)
2014,2013,2012,2011,2010,2009,2008,2007,2006,2005,2004,2003,2002,2001,2000,1999,1998,1997,1996,1995,1994,1993,1992,1991,1990,1989,1988,1987,1986,1985,1984,1983,1982
This statistics in other country:
AfghanistanAlbaniaAlgeriaAndorraAngolaAntigua and BarbudaArab WorldArgentinaArmeniaArubaAustraliaAustriaAzerbaijanBahamas, TheBahrainBangladeshBarbadosBelarusBelgiumBelizeBeninBermudaBhutanBoliviaBosnia and HerzegovinaBotswanaBrazilBrunei DarussalamBulgariaBurkina FasoBurundiCabo VerdeCambodiaCameroonCanadaCaribbean small statesCentral African RepublicCentral Europe and the BalticsChadChileChinaColombiaComorosCongo, Dem. Rep.Congo, Rep.Costa RicaCote d'IvoireCroatiaCubaCuracaoCyprusCzech RepublicDenmarkDjiboutiDominicaDominican RepublicEarly-demographic dividendEast Asia & PacificEast Asia & Pacific (excluding high income)East Asia & Pacific (IDA & IBRD countries)EcuadorEgypt, Arab Rep.El SalvadorEquatorial GuineaEritreaEstoniaEthiopiaEuro areaEurope & Central AsiaEurope & Central Asia (excluding high income)Europe & Central Asia (IDA & IBRD countries)European UnionFijiFinlandFragile and conflict affected situationsFranceGabonGambia, TheGeorgiaGermanyGhanaGreeceGrenadaGuatemalaGuineaGuinea-BissauGuyanaHaitiHeavily indebted poor countries (HIPC)High incomeHondurasHong Kong SAR, ChinaHungaryIBRD onlyIcelandIDA & IBRD totalIDA blendIDA onlyIDA totalIndiaIndonesiaIran, Islamic Rep.IraqIrelandIsraelItalyJamaicaJapanJordanKazakhstanKenyaKiribatiKorea, Dem. People’s Rep.Korea, Rep.KuwaitKyrgyz RepublicLao PDRLate-demographic dividendLatin America & Caribbean Latin America & Caribbean (excluding high income)Latin America & the Caribbean (IDA & IBRD countries)LatviaLeast developed countries: UN classificationLebanonLesothoLiberiaLibyaLiechtensteinLithuaniaLow & middle incomeLow incomeLower middle incomeLuxembourgMacao SAR, ChinaMacedonia, FYRMadagascarMalawiMaldivesMaliMaltaMarshall IslandsMauritaniaMauritiusMexicoMicronesia, Fed. Sts.Middle East & North AfricaMiddle East & North Africa (excluding high income)Middle East & North Africa (IDA & IBRD countries)Middle incomeMoldovaMongoliaMontenegroMoroccoMozambiqueMyanmarNamibiaNauruNepalNetherlandsNew ZealandNicaraguaNigerNigeriaNorth AmericaNorwayOECD membersOmanOther small statesPacific island small statesPakistanPalauPanamaPapua New GuineaParaguayPeruPhilippinesPolandPortugalPost-demographic dividendPre-demographic dividendPuerto RicoQatarRomaniaRussian FederationRwandaSamoaSan MarinoSao Tome and PrincipeSaudi ArabiaSenegalSerbiaSeychellesSierra LeoneSlovak RepublicSloveniaSmall statesSolomon IslandsSomaliaSouth AfricaSouth AsiaSouth Asia (IDA & IBRD)South SudanSpainSri LankaSt. Kitts and NevisSt. LuciaSt. Vincent and the GrenadinesSub-Saharan Africa Sub-Saharan Africa (excluding high income)Sub-Saharan Africa (IDA & IBRD countries)SudanSurinameSwazilandSwedenSwitzerlandSyrian Arab RepublicTajikistanTanzaniaThailandTimor-LesteTogoTongaTrinidad and TobagoTunisiaTurkeyTurkmenistanTuvaluUgandaUkraineUnited Arab EmiratesUnited KingdomUnited StatesUpper middle incomeUruguayUzbekistanVanuatuVenezuela, RBVietnamWest Bank and GazaWorldYemen, Rep.ZambiaZimbabwe Timeline:
This timeline shows a graph from 1982 to 2014 of Estonia. No data until 1981. Number of actual observations by date: 33.
Source name:
World Development Indicators
Source organization:
United Nations Educational, Scientific, and Cultural Organization (UNESCO) Institute for Statistics.
Categories, topics:
Education, Gender
Last updated:
apr 23, 2017
Indicators value changes by year
Minimum:
88.582
jan 1, 1994
Maximum:
113.397
jan 1, 1989
At the date of observation
Value
Absolute change
Change from previous value
jan 1, 1982
101.888
+101.888
0.0%
jan 1, 1983
101.791
-0.097
-0.09%
jan 1, 1984
101.437
-0.354
-0.35%
jan 1, 1985
101.007
-0.43
-0.42%
jan 1, 1986
102.402
+1.394
1.38%
jan 1, 1987
103.451
+1.049
1.02%
jan 1, 1988
111.704
+8.253
7.98%
jan 1, 1989
113.397
+1.693
1.52%
jan 1, 1990
111.767
-1.63
-1.44%
jan 1, 1991
92.095
-19.672
-17.6%
jan 1, 1992
90.894
-1.201
-1.3%
jan 1, 1993
90.516
-0.378
-0.42%
jan 1, 1994
88.582
-1.934
-2.14%
jan 1, 1995
89.374
+0.793
0.89%
jan 1, 1996
90.409
+1.035
1.16%
jan 1, 1997
94.348
+3.939
4.36%
jan 1, 1998
96.396
+2.048
2.17%
jan 1, 1999
98.68
+2.284
2.37%
jan 1, 2000
100.572
+1.891
1.92%
jan 1, 2001
102.438
+1.867
1.86%
jan 1, 2002
102.944
+0.506
0.49%
jan 1, 2003
101.451
-1.493
-1.45%
jan 1, 2004
99.902
-1.549
-1.53%
jan 1, 2005
98.479
-1.422
-1.42%
jan 1, 2006
97.584
-0.895
-0.91%
jan 1, 2007
96.467
-1.117
-1.14%
jan 1, 2008
98.108
+1.641
1.7%
jan 1, 2009
100.652
+2.544
2.59%
jan 1, 2010
102.099
+1.447
1.44%
jan 1, 2011
102.235
+0.137
0.13%
jan 1, 2012
101.572
-0.664
-0.65%
jan 1, 2013
101.553
-0.019
-0.02%
jan 1, 2014
100.407
-1.146
-1.13%
Ranking of countries by current statistics by years


Comments: