29
/
en
AIzaSyAYiBZKx7MnpbEhh9jyipgxe19OcubqV5w
April 1, 2024
174772
Lao PDR
LAO
true
2
1
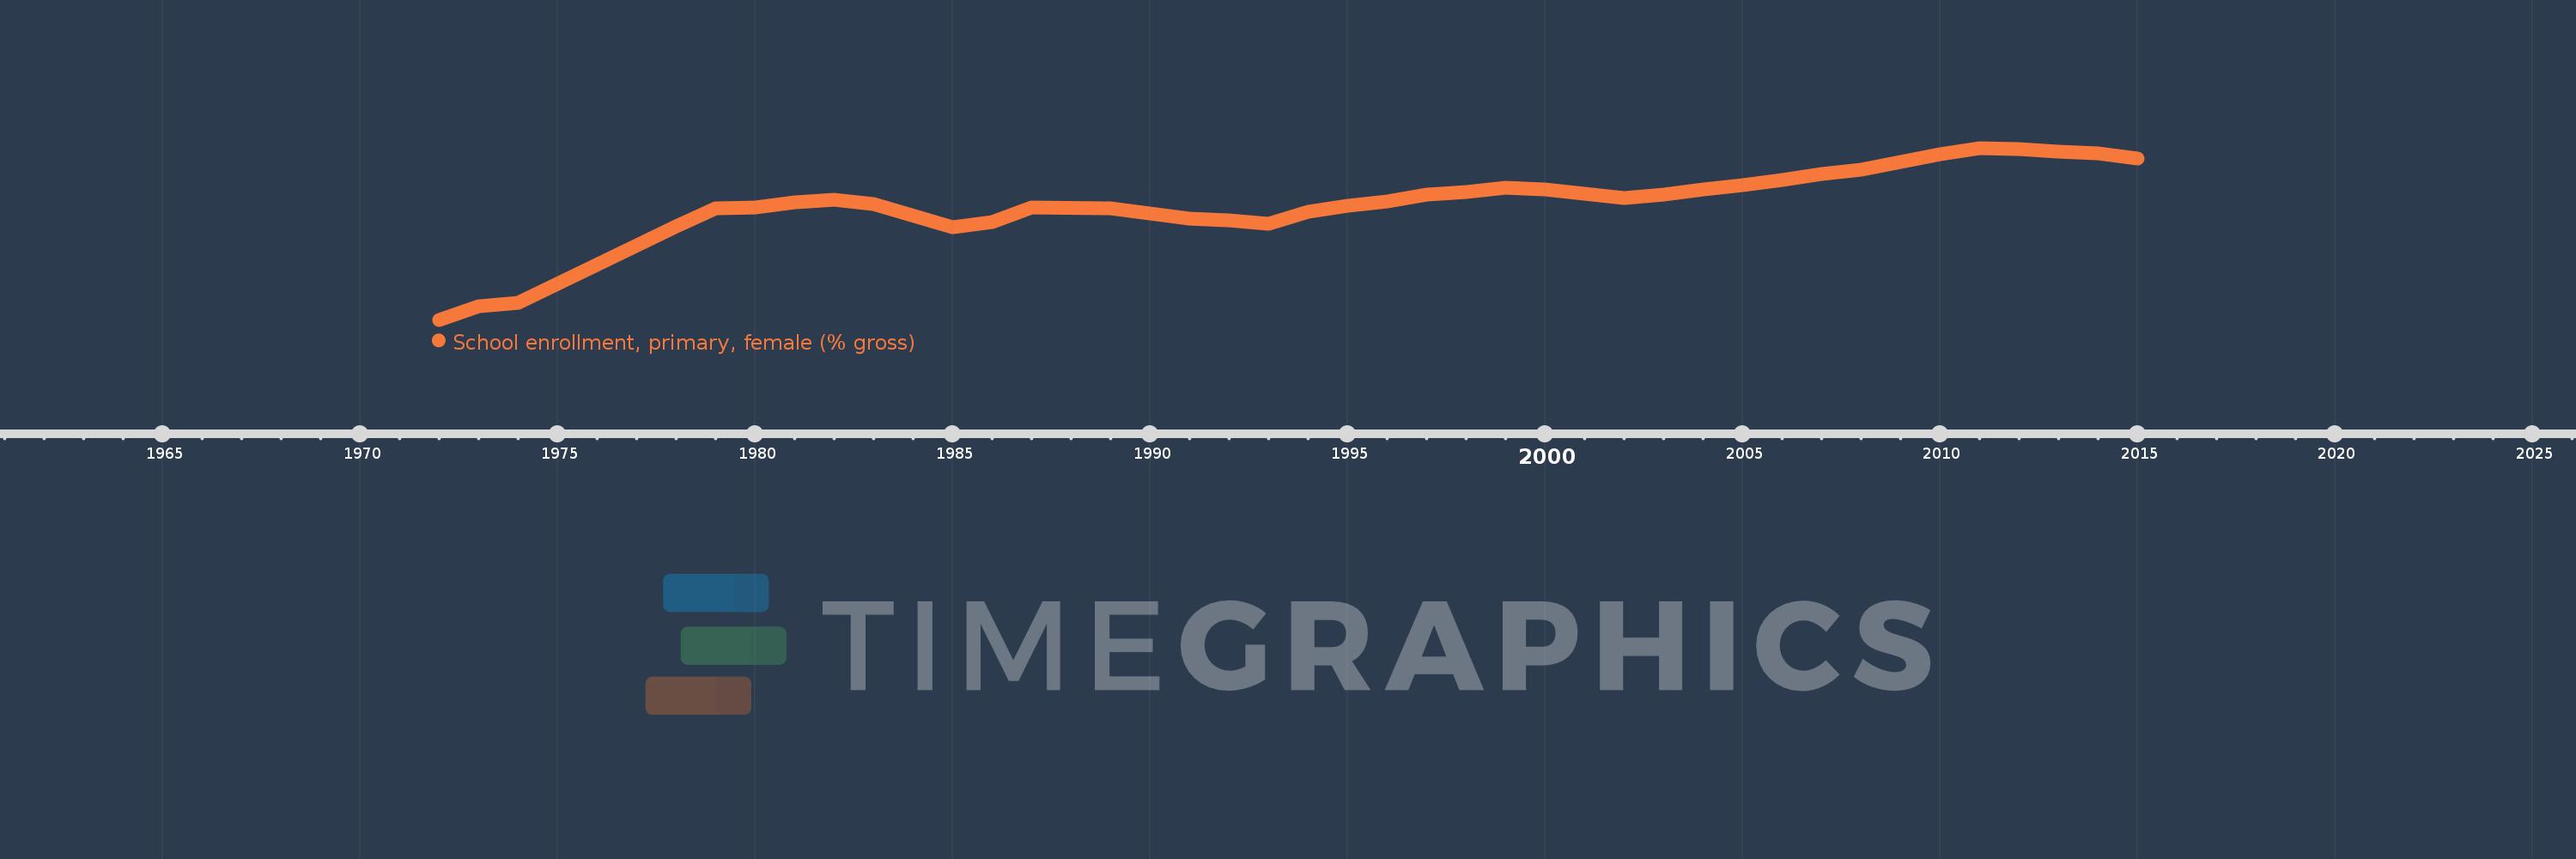
School enrollment, primary, female (% gross)
2015,2014,2013,2012,2011,2010,2009,2008,2007,2006,2005,2004,2003,2002,2001,2000,1999,1998,1997,1996,1995,1994,1993,1992,1991,1989,1987,1986,1985,1983,1982,1981,1980,1979,1978,1974,1973,1972
This statistics in other country:
AfghanistanAlbaniaAlgeriaAndorraAngolaAntigua and BarbudaArab WorldArgentinaArmeniaArubaAustraliaAustriaAzerbaijanBahamas, TheBahrainBangladeshBarbadosBelarusBelgiumBelizeBeninBermudaBhutanBoliviaBosnia and HerzegovinaBotswanaBrazilBrunei DarussalamBulgariaBurkina FasoBurundiCabo VerdeCambodiaCameroonCanadaCaribbean small statesCentral African RepublicCentral Europe and the BalticsChadChileChinaColombiaComorosCongo, Dem. Rep.Congo, Rep.Costa RicaCote d'IvoireCroatiaCubaCuracaoCyprusCzech RepublicDenmarkDjiboutiDominicaDominican RepublicEarly-demographic dividendEast Asia & PacificEast Asia & Pacific (excluding high income)East Asia & Pacific (IDA & IBRD countries)EcuadorEgypt, Arab Rep.El SalvadorEquatorial GuineaEritreaEstoniaEthiopiaEuro areaEurope & Central AsiaEurope & Central Asia (excluding high income)Europe & Central Asia (IDA & IBRD countries)European UnionFijiFinlandFragile and conflict affected situationsFranceGabonGambia, TheGeorgiaGermanyGhanaGreeceGrenadaGuatemalaGuineaGuinea-BissauGuyanaHaitiHeavily indebted poor countries (HIPC)High incomeHondurasHong Kong SAR, ChinaHungaryIBRD onlyIcelandIDA & IBRD totalIDA blendIDA onlyIDA totalIndiaIndonesiaIran, Islamic Rep.IraqIrelandIsraelItalyJamaicaJapanJordanKazakhstanKenyaKiribatiKorea, Dem. People’s Rep.Korea, Rep.KuwaitKyrgyz RepublicLao PDRLate-demographic dividendLatin America & Caribbean Latin America & Caribbean (excluding high income)Latin America & the Caribbean (IDA & IBRD countries)LatviaLeast developed countries: UN classificationLebanonLesothoLiberiaLibyaLiechtensteinLithuaniaLow & middle incomeLow incomeLower middle incomeLuxembourgMacao SAR, ChinaMacedonia, FYRMadagascarMalawiMaldivesMaliMaltaMarshall IslandsMauritaniaMauritiusMexicoMicronesia, Fed. Sts.Middle East & North AfricaMiddle East & North Africa (excluding high income)Middle East & North Africa (IDA & IBRD countries)Middle incomeMoldovaMongoliaMontenegroMoroccoMozambiqueMyanmarNamibiaNauruNepalNetherlandsNew ZealandNicaraguaNigerNigeriaNorth AmericaNorwayOECD membersOmanOther small statesPacific island small statesPakistanPalauPanamaPapua New GuineaParaguayPeruPhilippinesPolandPortugalPost-demographic dividendPre-demographic dividendPuerto RicoQatarRomaniaRussian FederationRwandaSamoaSan MarinoSao Tome and PrincipeSaudi ArabiaSenegalSerbiaSeychellesSierra LeoneSlovak RepublicSloveniaSmall statesSolomon IslandsSomaliaSouth AfricaSouth AsiaSouth Asia (IDA & IBRD)South SudanSpainSri LankaSt. Kitts and NevisSt. LuciaSt. Vincent and the GrenadinesSub-Saharan Africa Sub-Saharan Africa (excluding high income)Sub-Saharan Africa (IDA & IBRD countries)SudanSurinameSwazilandSwedenSwitzerlandSyrian Arab RepublicTajikistanTanzaniaThailandTimor-LesteTogoTongaTrinidad and TobagoTunisiaTurkeyTurkmenistanTuvaluUgandaUkraineUnited Arab EmiratesUnited KingdomUnited StatesUpper middle incomeUruguayUzbekistanVanuatuVenezuela, RBVietnamWest Bank and GazaWorldYemen, Rep.ZambiaZimbabwe Timeline:
This timeline shows a graph from 1972 to 2015 of Lao PDR. No data until 1971. Number of actual observations by date: 38.
Source name:
World Development Indicators
Source organization:
United Nations Educational, Scientific, and Cultural Organization (UNESCO) Institute for Statistics.
Categories, topics:
Education, Gender
Last updated:
apr 23, 2017
Indicators value changes by year
Minimum:
43.363
jan 1, 1972
Maximum:
117.907
jan 1, 2011
At the date of observation
Value
Absolute change
Change from previous value
jan 1, 1972
43.363
+43.363
0.0%
jan 1, 1973
49.361
+5.998
13.83%
jan 1, 1974
50.647
+1.286
2.6%
jan 1, 1978
83.748
+33.101
65.36%
jan 1, 1979
91.571
+7.823
9.34%
jan 1, 1980
92.162
+0.591
0.65%
jan 1, 1981
94.145
+1.983
2.15%
jan 1, 1982
95.395
+1.249
1.33%
jan 1, 1983
93.692
-1.703
-1.79%
jan 1, 1985
83.571
-10.121
-10.8%
jan 1, 1986
85.642
+2.071
2.48%
jan 1, 1987
92.081
+6.439
7.52%
jan 1, 1989
91.841
-0.24
-0.26%
jan 1, 1991
87.07
-4.771
-5.2%
jan 1, 1992
86.649
-0.421
-0.48%
jan 1, 1993
85.123
-1.527
-1.76%
jan 1, 1994
90.153
+5.031
5.91%
jan 1, 1995
92.884
+2.731
3.03%
jan 1, 1996
94.628
+1.744
1.88%
jan 1, 1997
97.846
+3.217
3.4%
jan 1, 1998
98.949
+1.103
1.13%
jan 1, 1999
100.82
+1.871
1.89%
jan 1, 2000
99.875
-0.945
-0.94%
jan 1, 2001
97.965
-1.909
-1.91%
jan 1, 2002
96.078
-1.888
-1.93%
jan 1, 2003
97.575
+1.497
1.56%
jan 1, 2004
99.844
+2.269
2.33%
jan 1, 2005
101.891
+2.046
2.05%
jan 1, 2006
104.113
+2.222
2.18%
jan 1, 2007
106.465
+2.352
2.26%
jan 1, 2008
108.566
+2.101
1.97%
jan 1, 2009
111.83
+3.264
3.01%
jan 1, 2010
115.047
+3.217
2.88%
jan 1, 2011
117.907
+2.86
2.49%
jan 1, 2012
117.447
-0.46
-0.39%
jan 1, 2013
116.422
-1.026
-0.87%
jan 1, 2014
115.625
-0.797
-0.68%
jan 1, 2015
113.493
-2.132
-1.84%
Ranking of countries by current statistics by years


Comments: