29
/
en
AIzaSyAYiBZKx7MnpbEhh9jyipgxe19OcubqV5w
April 1, 2024
170467
Korea, Rep.
KOR
true
2
1
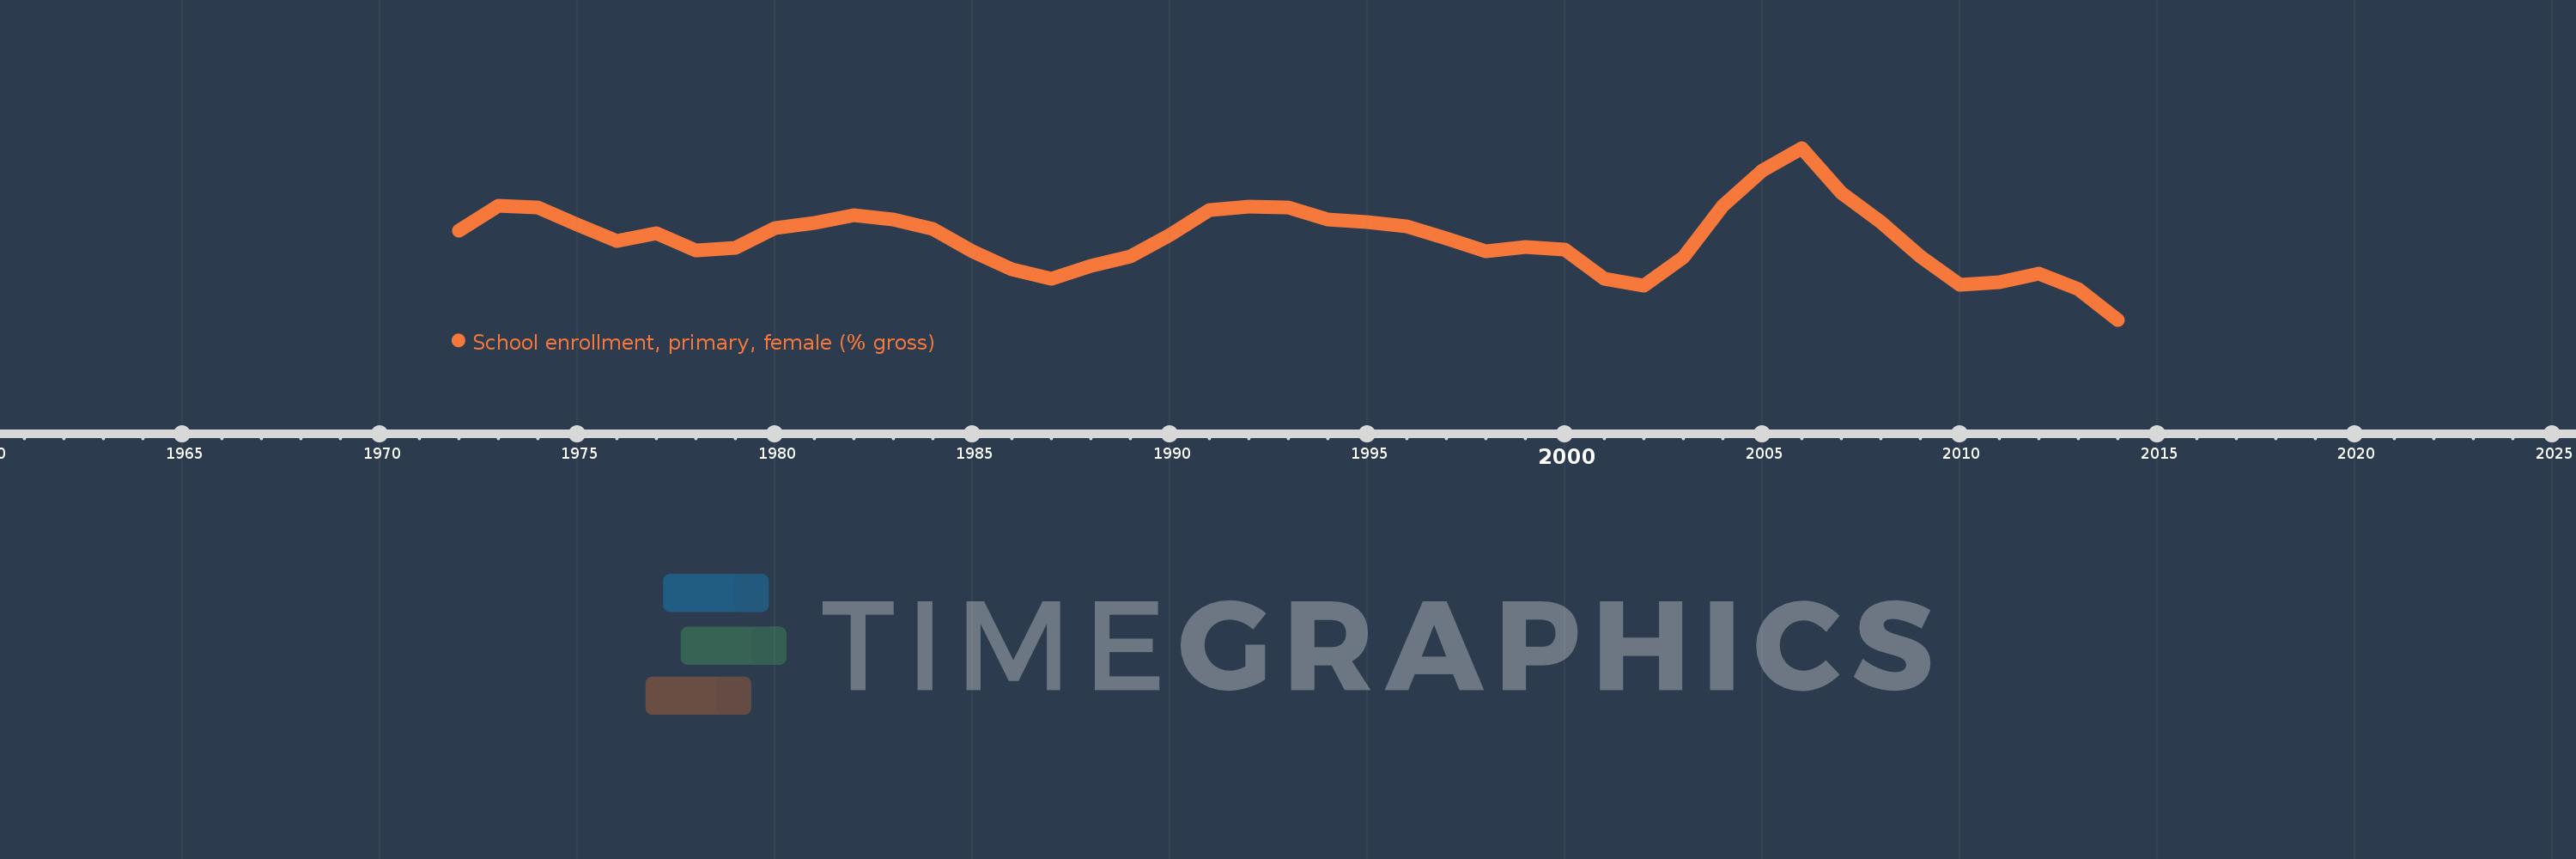
School enrollment, primary, female (% gross)
2014,2013,2012,2011,2010,2009,2008,2007,2006,2005,2004,2003,2002,2001,2000,1999,1998,1997,1996,1995,1994,1993,1992,1991,1990,1989,1988,1987,1986,1985,1984,1983,1982,1981,1980,1979,1978,1977,1976,1975,1974,1973,1972
This statistics in other country:
AfghanistanAlbaniaAlgeriaAndorraAngolaAntigua and BarbudaArab WorldArgentinaArmeniaArubaAustraliaAustriaAzerbaijanBahamas, TheBahrainBangladeshBarbadosBelarusBelgiumBelizeBeninBermudaBhutanBoliviaBosnia and HerzegovinaBotswanaBrazilBrunei DarussalamBulgariaBurkina FasoBurundiCabo VerdeCambodiaCameroonCanadaCaribbean small statesCentral African RepublicCentral Europe and the BalticsChadChileChinaColombiaComorosCongo, Dem. Rep.Congo, Rep.Costa RicaCote d'IvoireCroatiaCubaCuracaoCyprusCzech RepublicDenmarkDjiboutiDominicaDominican RepublicEarly-demographic dividendEast Asia & PacificEast Asia & Pacific (excluding high income)East Asia & Pacific (IDA & IBRD countries)EcuadorEgypt, Arab Rep.El SalvadorEquatorial GuineaEritreaEstoniaEthiopiaEuro areaEurope & Central AsiaEurope & Central Asia (excluding high income)Europe & Central Asia (IDA & IBRD countries)European UnionFijiFinlandFragile and conflict affected situationsFranceGabonGambia, TheGeorgiaGermanyGhanaGreeceGrenadaGuatemalaGuineaGuinea-BissauGuyanaHaitiHeavily indebted poor countries (HIPC)High incomeHondurasHong Kong SAR, ChinaHungaryIBRD onlyIcelandIDA & IBRD totalIDA blendIDA onlyIDA totalIndiaIndonesiaIran, Islamic Rep.IraqIrelandIsraelItalyJamaicaJapanJordanKazakhstanKenyaKiribatiKorea, Dem. People’s Rep.Korea, Rep.KuwaitKyrgyz RepublicLao PDRLate-demographic dividendLatin America & Caribbean Latin America & Caribbean (excluding high income)Latin America & the Caribbean (IDA & IBRD countries)LatviaLeast developed countries: UN classificationLebanonLesothoLiberiaLibyaLiechtensteinLithuaniaLow & middle incomeLow incomeLower middle incomeLuxembourgMacao SAR, ChinaMacedonia, FYRMadagascarMalawiMaldivesMaliMaltaMarshall IslandsMauritaniaMauritiusMexicoMicronesia, Fed. Sts.Middle East & North AfricaMiddle East & North Africa (excluding high income)Middle East & North Africa (IDA & IBRD countries)Middle incomeMoldovaMongoliaMontenegroMoroccoMozambiqueMyanmarNamibiaNauruNepalNetherlandsNew ZealandNicaraguaNigerNigeriaNorth AmericaNorwayOECD membersOmanOther small statesPacific island small statesPakistanPalauPanamaPapua New GuineaParaguayPeruPhilippinesPolandPortugalPost-demographic dividendPre-demographic dividendPuerto RicoQatarRomaniaRussian FederationRwandaSamoaSan MarinoSao Tome and PrincipeSaudi ArabiaSenegalSerbiaSeychellesSierra LeoneSlovak RepublicSloveniaSmall statesSolomon IslandsSomaliaSouth AfricaSouth AsiaSouth Asia (IDA & IBRD)South SudanSpainSri LankaSt. Kitts and NevisSt. LuciaSt. Vincent and the GrenadinesSub-Saharan Africa Sub-Saharan Africa (excluding high income)Sub-Saharan Africa (IDA & IBRD countries)SudanSurinameSwazilandSwedenSwitzerlandSyrian Arab RepublicTajikistanTanzaniaThailandTimor-LesteTogoTongaTrinidad and TobagoTunisiaTurkeyTurkmenistanTuvaluUgandaUkraineUnited Arab EmiratesUnited KingdomUnited StatesUpper middle incomeUruguayUzbekistanVanuatuVenezuela, RBVietnamWest Bank and GazaWorldYemen, Rep.ZambiaZimbabwe Timeline:
This timeline shows a graph from 1972 to 2014 of Korea, Rep.. No data until 1971. Number of actual observations by date: 43.
Source name:
World Development Indicators
Source organization:
United Nations Educational, Scientific, and Cultural Organization (UNESCO) Institute for Statistics.
Categories, topics:
Education, Gender
Last updated:
apr 23, 2017
Indicators value changes by year
Minimum:
98.553
jan 1, 2014
Maximum:
111.185
jan 1, 2006
At the date of observation
Value
Absolute change
Change from previous value
jan 1, 1972
105.113
+105.113
0.0%
jan 1, 1973
106.944
+1.831
1.74%
jan 1, 1974
106.791
-0.154
-0.14%
jan 1, 1975
105.544
-1.247
-1.17%
jan 1, 1976
104.325
-1.219
-1.15%
jan 1, 1977
104.939
+0.614
0.59%
jan 1, 1978
103.661
-1.277
-1.22%
jan 1, 1979
103.821
+0.159
0.15%
jan 1, 1980
105.314
+1.493
1.44%
jan 1, 1981
105.643
+0.329
0.31%
jan 1, 1982
106.228
+0.584
0.55%
jan 1, 1983
105.896
-0.331
-0.31%
jan 1, 1984
105.246
-0.65
-0.61%
jan 1, 1985
103.615
-1.631
-1.55%
jan 1, 1986
102.285
-1.329
-1.28%
jan 1, 1987
101.582
-0.703
-0.69%
jan 1, 1988
102.533
+0.951
0.94%
jan 1, 1989
103.2
+0.667
0.65%
jan 1, 1990
104.774
+1.574
1.53%
jan 1, 1991
106.613
+1.839
1.76%
jan 1, 1992
106.896
+0.283
0.27%
jan 1, 1993
106.795
-0.101
-0.09%
jan 1, 1994
105.905
-0.889
-0.83%
jan 1, 1995
105.76
-0.145
-0.14%
jan 1, 1996
105.428
-0.332
-0.31%
jan 1, 1997
104.564
-0.864
-0.82%
jan 1, 1998
103.58
-0.984
-0.94%
jan 1, 1999
103.893
+0.313
0.3%
jan 1, 2000
103.739
-0.155
-0.15%
jan 1, 2001
101.547
-2.192
-2.11%
jan 1, 2002
101.083
-0.464
-0.46%
jan 1, 2003
103.131
+2.048
2.03%
jan 1, 2004
106.911
+3.779
3.66%
jan 1, 2005
109.519
+2.608
2.44%
jan 1, 2006
111.185
+1.667
1.52%
jan 1, 2007
107.886
-3.3
-2.97%
jan 1, 2008
105.739
-2.147
-1.99%
jan 1, 2009
103.221
-2.518
-2.38%
jan 1, 2010
101.095
-2.126
-2.06%
jan 1, 2011
101.282
+0.187
0.18%
jan 1, 2012
101.915
+0.633
0.62%
jan 1, 2013
100.799
-1.116
-1.1%
jan 1, 2014
98.553
-2.246
-2.23%
Ranking of countries by current statistics by years


Comments: