29
/
en
AIzaSyAYiBZKx7MnpbEhh9jyipgxe19OcubqV5w
April 1, 2024
74361
Austria
AUT
true
2
1
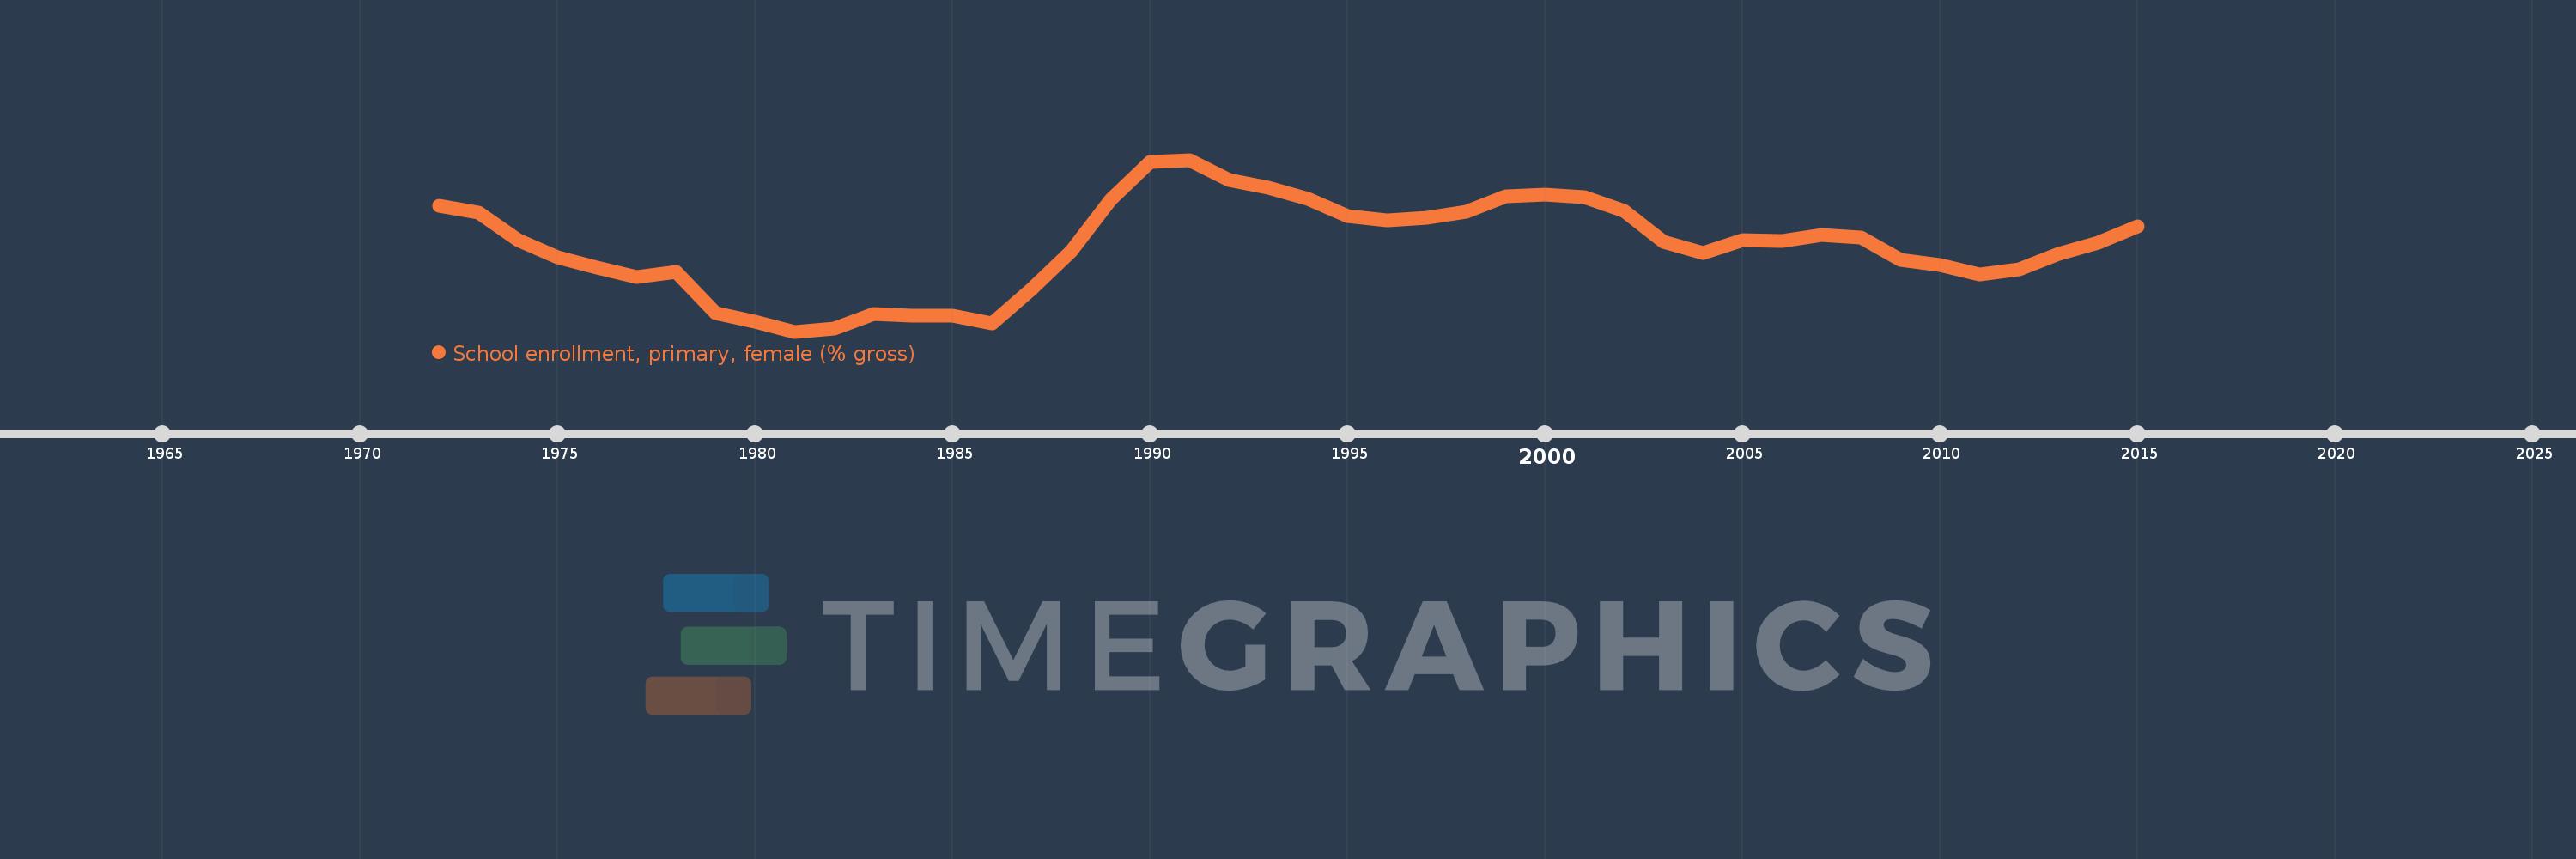
School enrollment, primary, female (% gross)
2015,2014,2013,2012,2011,2010,2009,2008,2007,2006,2005,2004,2003,2002,2001,2000,1999,1998,1997,1996,1995,1994,1993,1992,1991,1990,1989,1988,1987,1986,1985,1984,1983,1982,1981,1980,1979,1978,1977,1976,1975,1974,1973,1972
This statistics in other country:
AfghanistanAlbaniaAlgeriaAndorraAngolaAntigua and BarbudaArab WorldArgentinaArmeniaArubaAustraliaAustriaAzerbaijanBahamas, TheBahrainBangladeshBarbadosBelarusBelgiumBelizeBeninBermudaBhutanBoliviaBosnia and HerzegovinaBotswanaBrazilBrunei DarussalamBulgariaBurkina FasoBurundiCabo VerdeCambodiaCameroonCanadaCaribbean small statesCentral African RepublicCentral Europe and the BalticsChadChileChinaColombiaComorosCongo, Dem. Rep.Congo, Rep.Costa RicaCote d'IvoireCroatiaCubaCuracaoCyprusCzech RepublicDenmarkDjiboutiDominicaDominican RepublicEarly-demographic dividendEast Asia & PacificEast Asia & Pacific (excluding high income)East Asia & Pacific (IDA & IBRD countries)EcuadorEgypt, Arab Rep.El SalvadorEquatorial GuineaEritreaEstoniaEthiopiaEuro areaEurope & Central AsiaEurope & Central Asia (excluding high income)Europe & Central Asia (IDA & IBRD countries)European UnionFijiFinlandFragile and conflict affected situationsFranceGabonGambia, TheGeorgiaGermanyGhanaGreeceGrenadaGuatemalaGuineaGuinea-BissauGuyanaHaitiHeavily indebted poor countries (HIPC)High incomeHondurasHong Kong SAR, ChinaHungaryIBRD onlyIcelandIDA & IBRD totalIDA blendIDA onlyIDA totalIndiaIndonesiaIran, Islamic Rep.IraqIrelandIsraelItalyJamaicaJapanJordanKazakhstanKenyaKiribatiKorea, Dem. People’s Rep.Korea, Rep.KuwaitKyrgyz RepublicLao PDRLate-demographic dividendLatin America & Caribbean Latin America & Caribbean (excluding high income)Latin America & the Caribbean (IDA & IBRD countries)LatviaLeast developed countries: UN classificationLebanonLesothoLiberiaLibyaLiechtensteinLithuaniaLow & middle incomeLow incomeLower middle incomeLuxembourgMacao SAR, ChinaMacedonia, FYRMadagascarMalawiMaldivesMaliMaltaMarshall IslandsMauritaniaMauritiusMexicoMicronesia, Fed. Sts.Middle East & North AfricaMiddle East & North Africa (excluding high income)Middle East & North Africa (IDA & IBRD countries)Middle incomeMoldovaMongoliaMontenegroMoroccoMozambiqueMyanmarNamibiaNauruNepalNetherlandsNew ZealandNicaraguaNigerNigeriaNorth AmericaNorwayOECD membersOmanOther small statesPacific island small statesPakistanPalauPanamaPapua New GuineaParaguayPeruPhilippinesPolandPortugalPost-demographic dividendPre-demographic dividendPuerto RicoQatarRomaniaRussian FederationRwandaSamoaSan MarinoSao Tome and PrincipeSaudi ArabiaSenegalSerbiaSeychellesSierra LeoneSlovak RepublicSloveniaSmall statesSolomon IslandsSomaliaSouth AfricaSouth AsiaSouth Asia (IDA & IBRD)South SudanSpainSri LankaSt. Kitts and NevisSt. LuciaSt. Vincent and the GrenadinesSub-Saharan Africa Sub-Saharan Africa (excluding high income)Sub-Saharan Africa (IDA & IBRD countries)SudanSurinameSwazilandSwedenSwitzerlandSyrian Arab RepublicTajikistanTanzaniaThailandTimor-LesteTogoTongaTrinidad and TobagoTunisiaTurkeyTurkmenistanTuvaluUgandaUkraineUnited Arab EmiratesUnited KingdomUnited StatesUpper middle incomeUruguayUzbekistanVanuatuVenezuela, RBVietnamWest Bank and GazaWorldYemen, Rep.ZambiaZimbabwe Timeline:
This timeline shows a graph from 1972 to 2015 of Austria. No data until 1971. Number of actual observations by date: 44.
Source name:
World Development Indicators
Source organization:
United Nations Educational, Scientific, and Cultural Organization (UNESCO) Institute for Statistics.
Categories, topics:
Education, Gender
Last updated:
apr 23, 2017
Indicators value changes by year
Minimum:
96.054
jan 1, 1981
Maximum:
105.276
jan 1, 1991
At the date of observation
Value
Absolute change
Change from previous value
jan 1, 1972
102.801
+102.801
0.0%
jan 1, 1973
102.436
-0.366
-0.36%
jan 1, 1974
100.979
-1.457
-1.42%
jan 1, 1975
100.064
-0.915
-0.91%
jan 1, 1976
99.478
-0.586
-0.59%
jan 1, 1977
98.975
-0.503
-0.51%
jan 1, 1978
99.267
+0.291
0.29%
jan 1, 1979
97.041
-2.226
-2.24%
jan 1, 1980
96.59
-0.45
-0.46%
jan 1, 1981
96.054
-0.536
-0.56%
jan 1, 1982
96.216
+0.162
0.17%
jan 1, 1983
97.019
+0.803
0.83%
jan 1, 1984
96.92
-0.099
-0.1%
jan 1, 1985
96.93
+0.01
0.01%
jan 1, 1986
96.488
-0.442
-0.46%
jan 1, 1987
98.333
+1.845
1.91%
jan 1, 1988
100.365
+2.032
2.07%
jan 1, 1989
103.135
+2.77
2.76%
jan 1, 1990
105.177
+2.042
1.98%
jan 1, 1991
105.276
+0.099
0.09%
jan 1, 1992
104.172
-1.104
-1.05%
jan 1, 1993
103.771
-0.401
-0.38%
jan 1, 1994
103.2
-0.571
-0.55%
jan 1, 1995
102.247
-0.954
-0.92%
jan 1, 1996
102.036
-0.21
-0.21%
jan 1, 1997
102.163
+0.127
0.12%
jan 1, 1998
102.504
+0.341
0.33%
jan 1, 1999
103.297
+0.793
0.77%
jan 1, 2000
103.427
+0.13
0.13%
jan 1, 2001
103.259
-0.168
-0.16%
jan 1, 2002
102.542
-0.717
-0.69%
jan 1, 2003
100.873
-1.669
-1.63%
jan 1, 2004
100.296
-0.577
-0.57%
jan 1, 2005
100.951
+0.654
0.65%
jan 1, 2006
100.906
-0.045
-0.04%
jan 1, 2007
101.258
+0.352
0.35%
jan 1, 2008
101.094
-0.164
-0.16%
jan 1, 2009
99.883
-1.211
-1.2%
jan 1, 2010
99.62
-0.263
-0.26%
jan 1, 2011
99.142
-0.478
-0.48%
jan 1, 2012
99.38
+0.239
0.24%
jan 1, 2013
100.218
+0.837
0.84%
jan 1, 2014
100.806
+0.589
0.59%
jan 1, 2015
101.698
+0.892
0.88%
Ranking of countries by current statistics by years


Comments: