29
/
en
AIzaSyAYiBZKx7MnpbEhh9jyipgxe19OcubqV5w
April 1, 2024
182531
Luxembourg
LUX
true
2
1
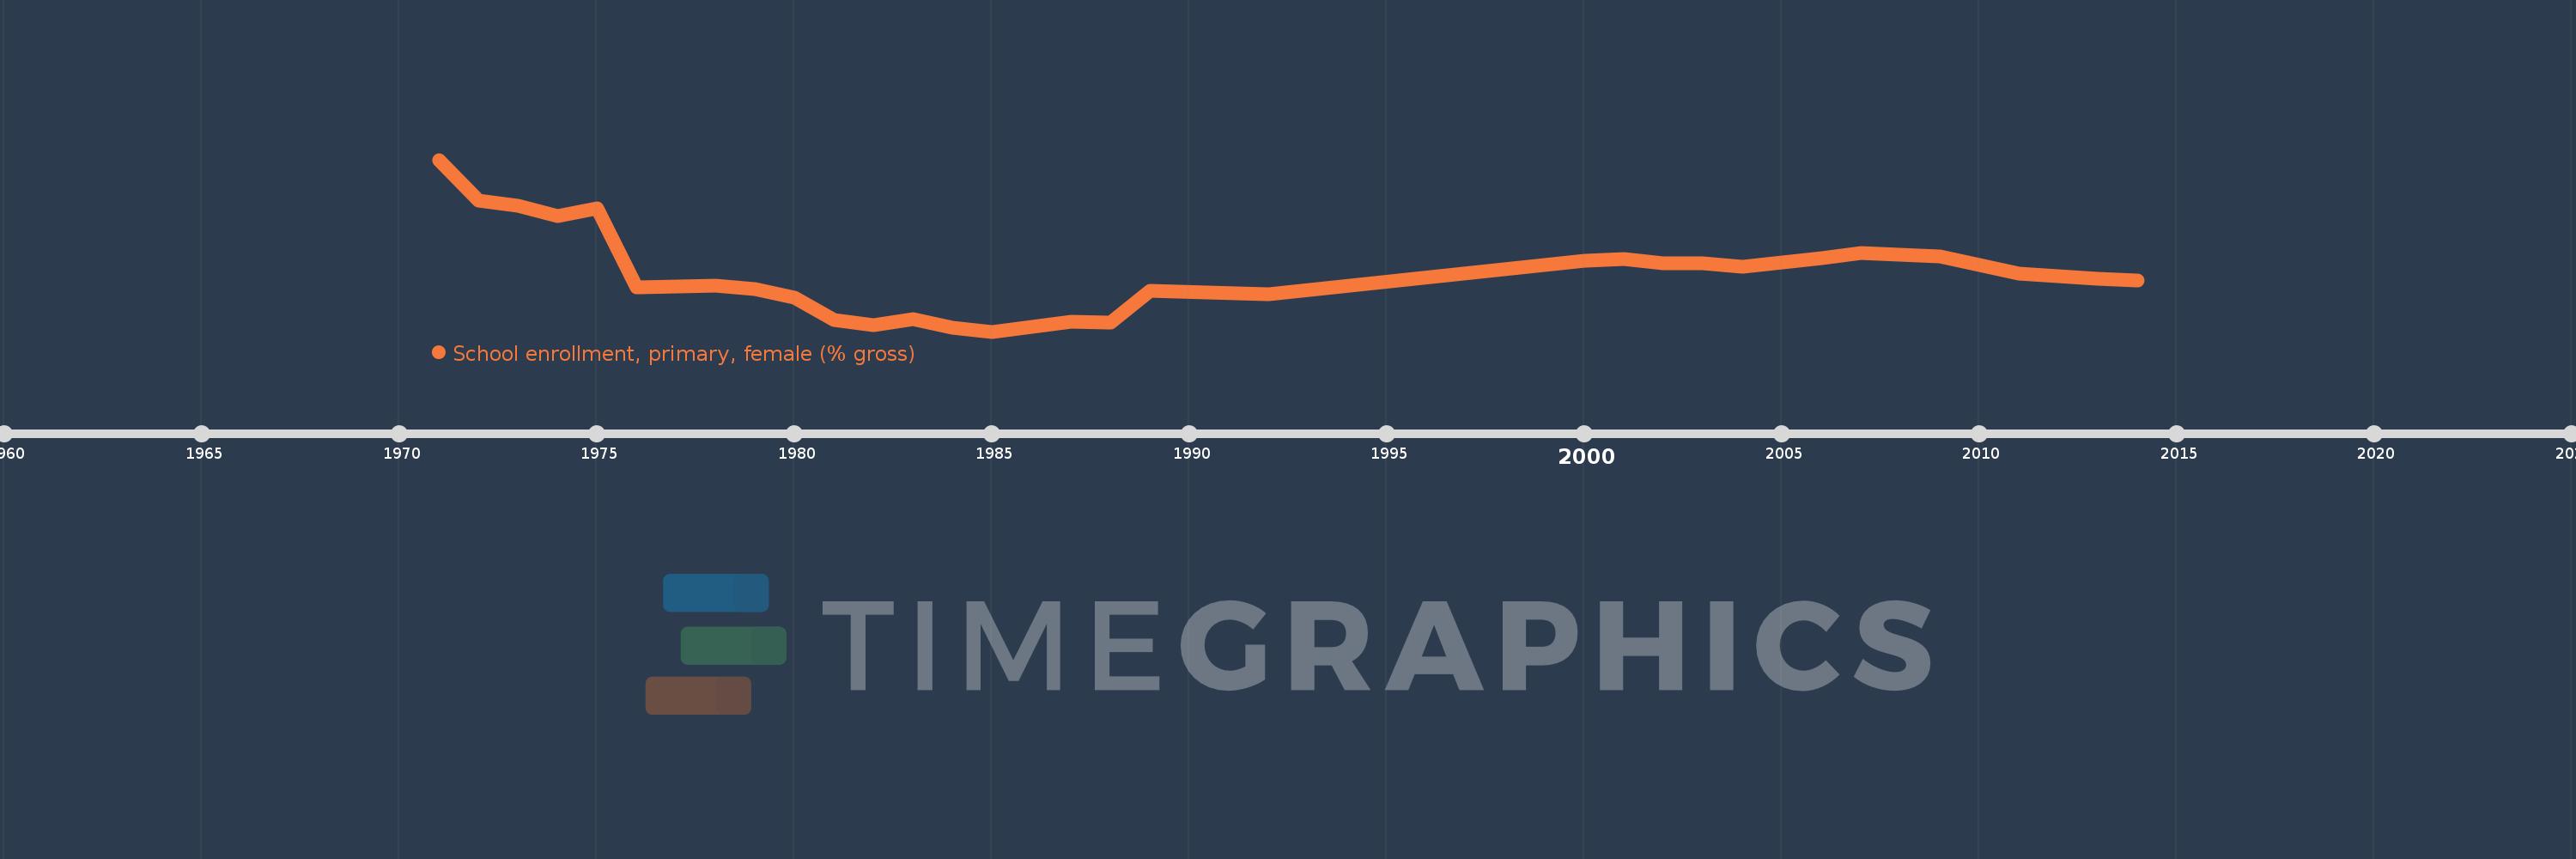
School enrollment, primary, female (% gross)
2014,2013,2012,2011,2009,2008,2007,2006,2005,2004,2003,2002,2001,2000,1992,1989,1988,1987,1985,1984,1983,1982,1981,1980,1979,1978,1977,1976,1975,1974,1973,1972,1971
This statistics in other country:
AfghanistanAlbaniaAlgeriaAndorraAngolaAntigua and BarbudaArab WorldArgentinaArmeniaArubaAustraliaAustriaAzerbaijanBahamas, TheBahrainBangladeshBarbadosBelarusBelgiumBelizeBeninBermudaBhutanBoliviaBosnia and HerzegovinaBotswanaBrazilBrunei DarussalamBulgariaBurkina FasoBurundiCabo VerdeCambodiaCameroonCanadaCaribbean small statesCentral African RepublicCentral Europe and the BalticsChadChileChinaColombiaComorosCongo, Dem. Rep.Congo, Rep.Costa RicaCote d'IvoireCroatiaCubaCuracaoCyprusCzech RepublicDenmarkDjiboutiDominicaDominican RepublicEarly-demographic dividendEast Asia & PacificEast Asia & Pacific (excluding high income)East Asia & Pacific (IDA & IBRD countries)EcuadorEgypt, Arab Rep.El SalvadorEquatorial GuineaEritreaEstoniaEthiopiaEuro areaEurope & Central AsiaEurope & Central Asia (excluding high income)Europe & Central Asia (IDA & IBRD countries)European UnionFijiFinlandFragile and conflict affected situationsFranceGabonGambia, TheGeorgiaGermanyGhanaGreeceGrenadaGuatemalaGuineaGuinea-BissauGuyanaHaitiHeavily indebted poor countries (HIPC)High incomeHondurasHong Kong SAR, ChinaHungaryIBRD onlyIcelandIDA & IBRD totalIDA blendIDA onlyIDA totalIndiaIndonesiaIran, Islamic Rep.IraqIrelandIsraelItalyJamaicaJapanJordanKazakhstanKenyaKiribatiKorea, Dem. People’s Rep.Korea, Rep.KuwaitKyrgyz RepublicLao PDRLate-demographic dividendLatin America & Caribbean Latin America & Caribbean (excluding high income)Latin America & the Caribbean (IDA & IBRD countries)LatviaLeast developed countries: UN classificationLebanonLesothoLiberiaLibyaLiechtensteinLithuaniaLow & middle incomeLow incomeLower middle incomeLuxembourgMacao SAR, ChinaMacedonia, FYRMadagascarMalawiMaldivesMaliMaltaMarshall IslandsMauritaniaMauritiusMexicoMicronesia, Fed. Sts.Middle East & North AfricaMiddle East & North Africa (excluding high income)Middle East & North Africa (IDA & IBRD countries)Middle incomeMoldovaMongoliaMontenegroMoroccoMozambiqueMyanmarNamibiaNauruNepalNetherlandsNew ZealandNicaraguaNigerNigeriaNorth AmericaNorwayOECD membersOmanOther small statesPacific island small statesPakistanPalauPanamaPapua New GuineaParaguayPeruPhilippinesPolandPortugalPost-demographic dividendPre-demographic dividendPuerto RicoQatarRomaniaRussian FederationRwandaSamoaSan MarinoSao Tome and PrincipeSaudi ArabiaSenegalSerbiaSeychellesSierra LeoneSlovak RepublicSloveniaSmall statesSolomon IslandsSomaliaSouth AfricaSouth AsiaSouth Asia (IDA & IBRD)South SudanSpainSri LankaSt. Kitts and NevisSt. LuciaSt. Vincent and the GrenadinesSub-Saharan Africa Sub-Saharan Africa (excluding high income)Sub-Saharan Africa (IDA & IBRD countries)SudanSurinameSwazilandSwedenSwitzerlandSyrian Arab RepublicTajikistanTanzaniaThailandTimor-LesteTogoTongaTrinidad and TobagoTunisiaTurkeyTurkmenistanTuvaluUgandaUkraineUnited Arab EmiratesUnited KingdomUnited StatesUpper middle incomeUruguayUzbekistanVanuatuVenezuela, RBVietnamWest Bank and GazaWorldYemen, Rep.ZambiaZimbabwe Timeline:
This timeline shows a graph from 1971 to 2014 of Luxembourg. No data until 1970. Number of actual observations by date: 33.
Source name:
World Development Indicators
Source organization:
United Nations Educational, Scientific, and Cultural Organization (UNESCO) Institute for Statistics.
Categories, topics:
Education, Gender
Last updated:
apr 23, 2017
Indicators value changes by year
Minimum:
87.744
jan 1, 1985
Maximum:
118.401
jan 1, 1971
At the date of observation
Value
Absolute change
Change from previous value
jan 1, 1971
118.401
+118.401
0.0%
jan 1, 1972
111.145
-7.255
-6.13%
jan 1, 1973
110.183
-0.962
-0.87%
jan 1, 1974
108.312
-1.871
-1.7%
jan 1, 1975
109.698
+1.385
1.28%
jan 1, 1976
95.632
-14.065
-12.82%
jan 1, 1977
95.745
+0.113
0.12%
jan 1, 1978
95.93
+0.185
0.19%
jan 1, 1979
95.331
-0.599
-0.62%
jan 1, 1980
93.777
-1.554
-1.63%
jan 1, 1981
89.762
-4.015
-4.28%
jan 1, 1982
88.857
-0.905
-1.01%
jan 1, 1983
89.976
+1.118
1.26%
jan 1, 1984
88.505
-1.471
-1.63%
jan 1, 1985
87.744
-0.761
-0.86%
jan 1, 1987
89.491
+1.746
1.99%
jan 1, 1988
89.284
-0.207
-0.23%
jan 1, 1989
95.016
+5.732
6.42%
jan 1, 1992
94.423
-0.593
-0.62%
jan 1, 2000
100.428
+6.005
6.36%
jan 1, 2001
100.72
+0.292
0.29%
jan 1, 2002
99.938
-0.781
-0.78%
jan 1, 2003
99.952
+0.013
0.01%
jan 1, 2004
99.282
-0.669
-0.67%
jan 1, 2005
100.048
+0.765
0.77%
jan 1, 2006
100.886
+0.839
0.84%
jan 1, 2007
101.745
+0.859
0.85%
jan 1, 2008
101.507
-0.239
-0.23%
jan 1, 2009
101.119
-0.388
-0.38%
jan 1, 2011
98.124
-2.995
-2.96%
jan 1, 2012
97.566
-0.558
-0.57%
jan 1, 2013
97.205
-0.361
-0.37%
jan 1, 2014
96.859
-0.345
-0.36%
Ranking of countries by current statistics by years


Comments: