29
/
en
AIzaSyAYiBZKx7MnpbEhh9jyipgxe19OcubqV5w
April 1, 2024
49576
Middle East & North Africa (excluding high income)
MNA
false
2
1
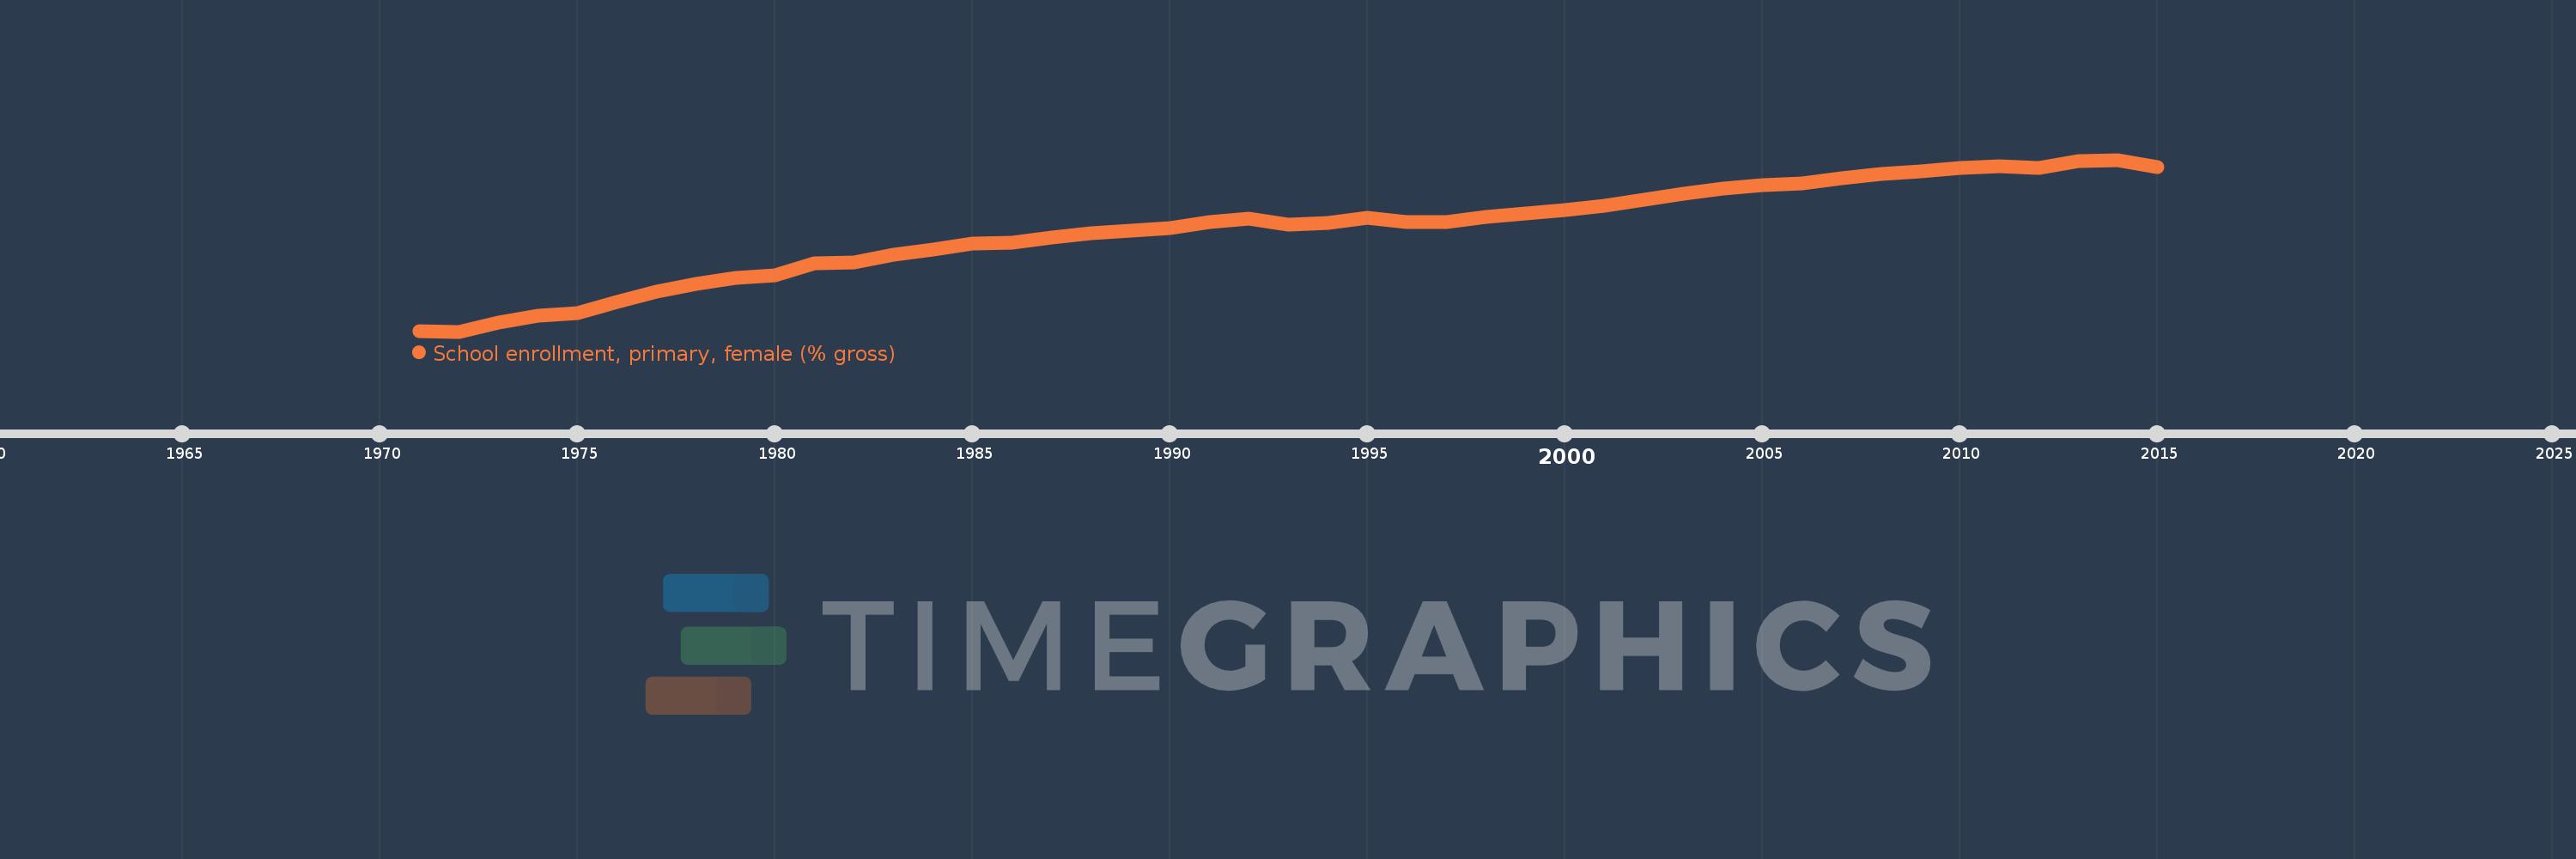
School enrollment, primary, female (% gross)
2015,2014,2013,2012,2011,2010,2009,2008,2007,2006,2005,2004,2003,2002,2001,2000,1999,1998,1997,1996,1995,1994,1993,1992,1991,1990,1989,1988,1987,1986,1985,1984,1983,1982,1981,1980,1979,1978,1977,1976,1975,1974,1973,1972,1971
This statistics in other country:
AfghanistanAlbaniaAlgeriaAndorraAngolaAntigua and BarbudaArab WorldArgentinaArmeniaArubaAustraliaAustriaAzerbaijanBahamas, TheBahrainBangladeshBarbadosBelarusBelgiumBelizeBeninBermudaBhutanBoliviaBosnia and HerzegovinaBotswanaBrazilBrunei DarussalamBulgariaBurkina FasoBurundiCabo VerdeCambodiaCameroonCanadaCaribbean small statesCentral African RepublicCentral Europe and the BalticsChadChileChinaColombiaComorosCongo, Dem. Rep.Congo, Rep.Costa RicaCote d'IvoireCroatiaCubaCuracaoCyprusCzech RepublicDenmarkDjiboutiDominicaDominican RepublicEarly-demographic dividendEast Asia & PacificEast Asia & Pacific (excluding high income)East Asia & Pacific (IDA & IBRD countries)EcuadorEgypt, Arab Rep.El SalvadorEquatorial GuineaEritreaEstoniaEthiopiaEuro areaEurope & Central AsiaEurope & Central Asia (excluding high income)Europe & Central Asia (IDA & IBRD countries)European UnionFijiFinlandFragile and conflict affected situationsFranceGabonGambia, TheGeorgiaGermanyGhanaGreeceGrenadaGuatemalaGuineaGuinea-BissauGuyanaHaitiHeavily indebted poor countries (HIPC)High incomeHondurasHong Kong SAR, ChinaHungaryIBRD onlyIcelandIDA & IBRD totalIDA blendIDA onlyIDA totalIndiaIndonesiaIran, Islamic Rep.IraqIrelandIsraelItalyJamaicaJapanJordanKazakhstanKenyaKiribatiKorea, Dem. People’s Rep.Korea, Rep.KuwaitKyrgyz RepublicLao PDRLate-demographic dividendLatin America & Caribbean Latin America & Caribbean (excluding high income)Latin America & the Caribbean (IDA & IBRD countries)LatviaLeast developed countries: UN classificationLebanonLesothoLiberiaLibyaLiechtensteinLithuaniaLow & middle incomeLow incomeLower middle incomeLuxembourgMacao SAR, ChinaMacedonia, FYRMadagascarMalawiMaldivesMaliMaltaMarshall IslandsMauritaniaMauritiusMexicoMicronesia, Fed. Sts.Middle East & North AfricaMiddle East & North Africa (excluding high income)Middle East & North Africa (IDA & IBRD countries)Middle incomeMoldovaMongoliaMontenegroMoroccoMozambiqueMyanmarNamibiaNauruNepalNetherlandsNew ZealandNicaraguaNigerNigeriaNorth AmericaNorwayOECD membersOmanOther small statesPacific island small statesPakistanPalauPanamaPapua New GuineaParaguayPeruPhilippinesPolandPortugalPost-demographic dividendPre-demographic dividendPuerto RicoQatarRomaniaRussian FederationRwandaSamoaSan MarinoSao Tome and PrincipeSaudi ArabiaSenegalSerbiaSeychellesSierra LeoneSlovak RepublicSloveniaSmall statesSolomon IslandsSomaliaSouth AfricaSouth AsiaSouth Asia (IDA & IBRD)South SudanSpainSri LankaSt. Kitts and NevisSt. LuciaSt. Vincent and the GrenadinesSub-Saharan Africa Sub-Saharan Africa (excluding high income)Sub-Saharan Africa (IDA & IBRD countries)SudanSurinameSwazilandSwedenSwitzerlandSyrian Arab RepublicTajikistanTanzaniaThailandTimor-LesteTogoTongaTrinidad and TobagoTunisiaTurkeyTurkmenistanTuvaluUgandaUkraineUnited Arab EmiratesUnited KingdomUnited StatesUpper middle incomeUruguayUzbekistanVanuatuVenezuela, RBVietnamWest Bank and GazaWorldYemen, Rep.ZambiaZimbabwe Timeline:
This timeline shows a graph from 1971 to 2015 of Middle East & North Africa (excluding high income). No data until 1970. Number of actual observations by date: 45.
Source name:
World Development Indicators
Source organization:
United Nations Educational, Scientific, and Cultural Organization (UNESCO) Institute for Statistics.
Categories, topics:
Education, Gender
Last updated:
apr 23, 2017
Indicators value changes by year
Minimum:
54.318
jan 1, 1972
Maximum:
104.75
jan 1, 2014
At the date of observation
Value
Absolute change
Change from previous value
jan 1, 1971
54.356
+54.356
0.0%
jan 1, 1972
54.318
-0.038
-0.07%
jan 1, 1973
56.956
+2.638
4.86%
jan 1, 1974
58.858
+1.902
3.34%
jan 1, 1975
59.839
+0.981
1.67%
jan 1, 1976
62.919
+3.081
5.15%
jan 1, 1977
65.986
+3.067
4.87%
jan 1, 1978
68.257
+2.271
3.44%
jan 1, 1979
69.991
+1.733
2.54%
jan 1, 1980
70.888
+0.898
1.28%
jan 1, 1981
74.256
+3.368
4.75%
jan 1, 1982
74.614
+0.357
0.48%
jan 1, 1983
76.876
+2.263
3.03%
jan 1, 1984
78.311
+1.434
1.87%
jan 1, 1985
80.041
+1.73
2.21%
jan 1, 1986
80.486
+0.445
0.56%
jan 1, 1987
81.907
+1.421
1.77%
jan 1, 1988
83.262
+1.354
1.65%
jan 1, 1989
83.963
+0.702
0.84%
jan 1, 1990
84.586
+0.623
0.74%
jan 1, 1991
86.398
+1.812
2.14%
jan 1, 1992
87.416
+1.019
1.18%
jan 1, 1993
85.777
-1.639
-1.87%
jan 1, 1994
86.168
+0.391
0.46%
jan 1, 1995
87.808
+1.64
1.9%
jan 1, 1996
86.488
-1.32
-1.5%
jan 1, 1997
86.593
+0.105
0.12%
jan 1, 1998
87.996
+1.403
1.62%
jan 1, 1999
88.953
+0.956
1.09%
jan 1, 2000
90.063
+1.11
1.25%
jan 1, 2001
91.237
+1.174
1.3%
jan 1, 2002
92.959
+1.722
1.89%
jan 1, 2003
94.73
+1.771
1.91%
jan 1, 2004
96.314
+1.585
1.67%
jan 1, 2005
97.284
+0.97
1.01%
jan 1, 2006
97.703
+0.418
0.43%
jan 1, 2007
99.209
+1.506
1.54%
jan 1, 2008
100.625
+1.416
1.43%
jan 1, 2009
101.448
+0.823
0.82%
jan 1, 2010
102.394
+0.946
0.93%
jan 1, 2011
102.978
+0.584
0.57%
jan 1, 2012
102.302
-0.676
-0.66%
jan 1, 2013
104.274
+1.972
1.93%
jan 1, 2014
104.75
+0.476
0.46%
jan 1, 2015
102.49
-2.26
-2.16%
Ranking of countries by current statistics by years


Comments: