29
/
en
AIzaSyAYiBZKx7MnpbEhh9jyipgxe19OcubqV5w
April 1, 2024
77595
Bahrain
BHR
true
2
1
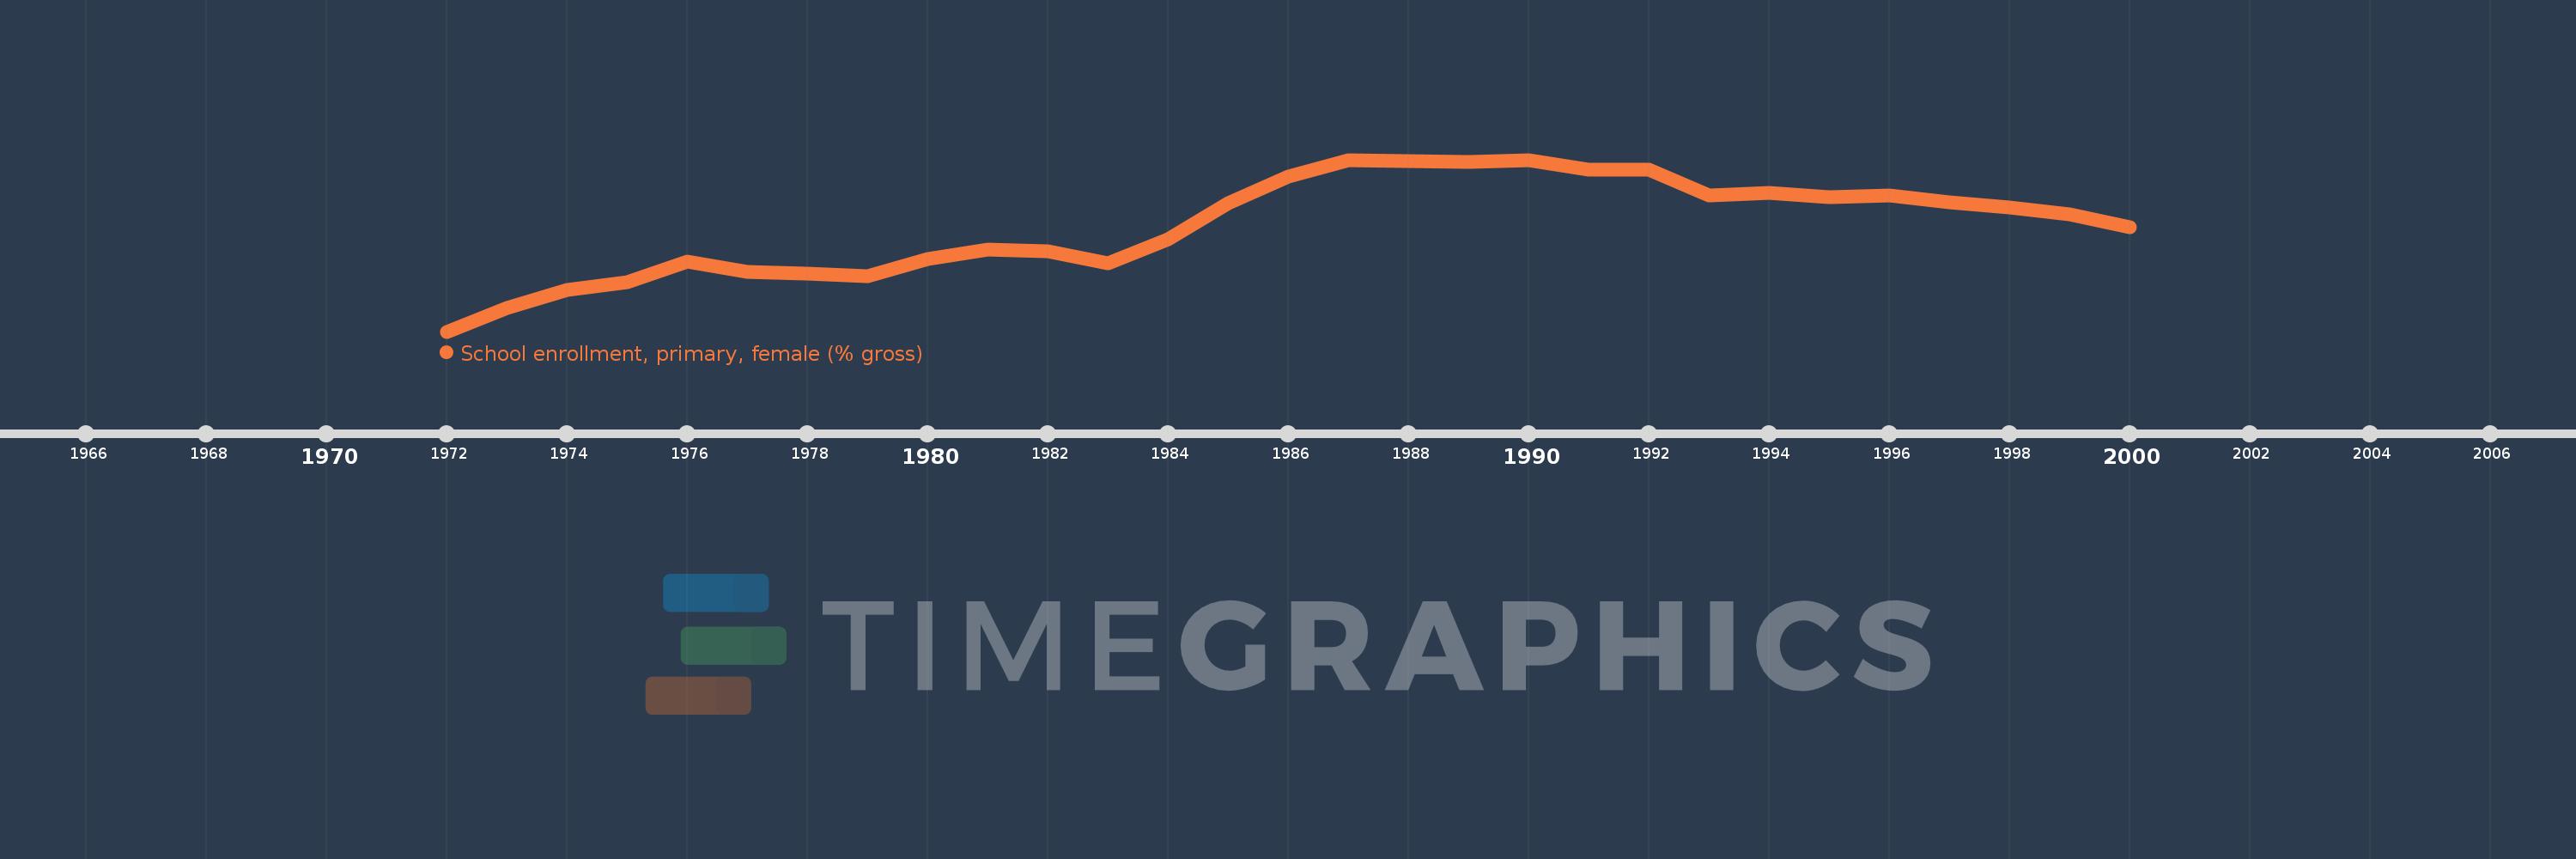
School enrollment, primary, female (% gross)
2000,1999,1998,1997,1996,1995,1994,1993,1992,1991,1990,1989,1988,1987,1986,1985,1984,1983,1982,1981,1980,1979,1978,1977,1976,1975,1974,1973,1972
This statistics in other country:
AfghanistanAlbaniaAlgeriaAndorraAngolaAntigua and BarbudaArab WorldArgentinaArmeniaArubaAustraliaAustriaAzerbaijanBahamas, TheBahrainBangladeshBarbadosBelarusBelgiumBelizeBeninBermudaBhutanBoliviaBosnia and HerzegovinaBotswanaBrazilBrunei DarussalamBulgariaBurkina FasoBurundiCabo VerdeCambodiaCameroonCanadaCaribbean small statesCentral African RepublicCentral Europe and the BalticsChadChileChinaColombiaComorosCongo, Dem. Rep.Congo, Rep.Costa RicaCote d'IvoireCroatiaCubaCuracaoCyprusCzech RepublicDenmarkDjiboutiDominicaDominican RepublicEarly-demographic dividendEast Asia & PacificEast Asia & Pacific (excluding high income)East Asia & Pacific (IDA & IBRD countries)EcuadorEgypt, Arab Rep.El SalvadorEquatorial GuineaEritreaEstoniaEthiopiaEuro areaEurope & Central AsiaEurope & Central Asia (excluding high income)Europe & Central Asia (IDA & IBRD countries)European UnionFijiFinlandFragile and conflict affected situationsFranceGabonGambia, TheGeorgiaGermanyGhanaGreeceGrenadaGuatemalaGuineaGuinea-BissauGuyanaHaitiHeavily indebted poor countries (HIPC)High incomeHondurasHong Kong SAR, ChinaHungaryIBRD onlyIcelandIDA & IBRD totalIDA blendIDA onlyIDA totalIndiaIndonesiaIran, Islamic Rep.IraqIrelandIsraelItalyJamaicaJapanJordanKazakhstanKenyaKiribatiKorea, Dem. People’s Rep.Korea, Rep.KuwaitKyrgyz RepublicLao PDRLate-demographic dividendLatin America & Caribbean Latin America & Caribbean (excluding high income)Latin America & the Caribbean (IDA & IBRD countries)LatviaLeast developed countries: UN classificationLebanonLesothoLiberiaLibyaLiechtensteinLithuaniaLow & middle incomeLow incomeLower middle incomeLuxembourgMacao SAR, ChinaMacedonia, FYRMadagascarMalawiMaldivesMaliMaltaMarshall IslandsMauritaniaMauritiusMexicoMicronesia, Fed. Sts.Middle East & North AfricaMiddle East & North Africa (excluding high income)Middle East & North Africa (IDA & IBRD countries)Middle incomeMoldovaMongoliaMontenegroMoroccoMozambiqueMyanmarNamibiaNauruNepalNetherlandsNew ZealandNicaraguaNigerNigeriaNorth AmericaNorwayOECD membersOmanOther small statesPacific island small statesPakistanPalauPanamaPapua New GuineaParaguayPeruPhilippinesPolandPortugalPost-demographic dividendPre-demographic dividendPuerto RicoQatarRomaniaRussian FederationRwandaSamoaSan MarinoSao Tome and PrincipeSaudi ArabiaSenegalSerbiaSeychellesSierra LeoneSlovak RepublicSloveniaSmall statesSolomon IslandsSomaliaSouth AfricaSouth AsiaSouth Asia (IDA & IBRD)South SudanSpainSri LankaSt. Kitts and NevisSt. LuciaSt. Vincent and the GrenadinesSub-Saharan Africa Sub-Saharan Africa (excluding high income)Sub-Saharan Africa (IDA & IBRD countries)SudanSurinameSwazilandSwedenSwitzerlandSyrian Arab RepublicTajikistanTanzaniaThailandTimor-LesteTogoTongaTrinidad and TobagoTunisiaTurkeyTurkmenistanTuvaluUgandaUkraineUnited Arab EmiratesUnited KingdomUnited StatesUpper middle incomeUruguayUzbekistanVanuatuVenezuela, RBVietnamWest Bank and GazaWorldYemen, Rep.ZambiaZimbabwe Timeline:
This timeline shows a graph from 1972 to 2000 of Bahrain. No data until 1971. Number of actual observations by date: 29.
Source name:
World Development Indicators
Source organization:
United Nations Educational, Scientific, and Cultural Organization (UNESCO) Institute for Statistics.
Categories, topics:
Education, Gender
Last updated:
apr 23, 2017
Indicators value changes by year
Minimum:
89.323
jan 1, 1972
Maximum:
113.451
jan 1, 1990
At the date of observation
Value
Absolute change
Change from previous value
jan 1, 1972
89.323
+89.323
0.0%
jan 1, 1973
92.693
+3.37
3.77%
jan 1, 1974
95.131
+2.439
2.63%
jan 1, 1975
96.259
+1.128
1.19%
jan 1, 1976
99.211
+2.952
3.07%
jan 1, 1977
97.703
-1.508
-1.52%
jan 1, 1978
97.429
-0.274
-0.28%
jan 1, 1979
97.058
-0.371
-0.38%
jan 1, 1980
99.573
+2.515
2.59%
jan 1, 1981
100.786
+1.213
1.22%
jan 1, 1982
100.628
-0.158
-0.16%
jan 1, 1983
98.949
-1.679
-1.67%
jan 1, 1984
102.307
+3.359
3.39%
jan 1, 1985
107.306
+4.999
4.89%
jan 1, 1986
111.058
+3.752
3.5%
jan 1, 1987
113.382
+2.323
2.09%
jan 1, 1988
113.234
-0.148
-0.13%
jan 1, 1989
113.199
-0.035
-0.03%
jan 1, 1990
113.451
+0.252
0.22%
jan 1, 1991
112.09
-1.362
-1.2%
jan 1, 1992
112.048
-0.041
-0.04%
jan 1, 1993
108.484
-3.564
-3.18%
jan 1, 1994
108.782
+0.298
0.27%
jan 1, 1995
108.261
-0.522
-0.48%
jan 1, 1996
108.411
+0.15
0.14%
jan 1, 1997
107.439
-0.972
-0.9%
jan 1, 1998
106.758
-0.681
-0.63%
jan 1, 1999
105.826
-0.932
-0.87%
jan 1, 2000
103.925
-1.901
-1.8%
Ranking of countries by current statistics by years


Comments: