29
/
en
AIzaSyAYiBZKx7MnpbEhh9jyipgxe19OcubqV5w
April 1, 2024
231706
Rwanda
RWA
true
2
1
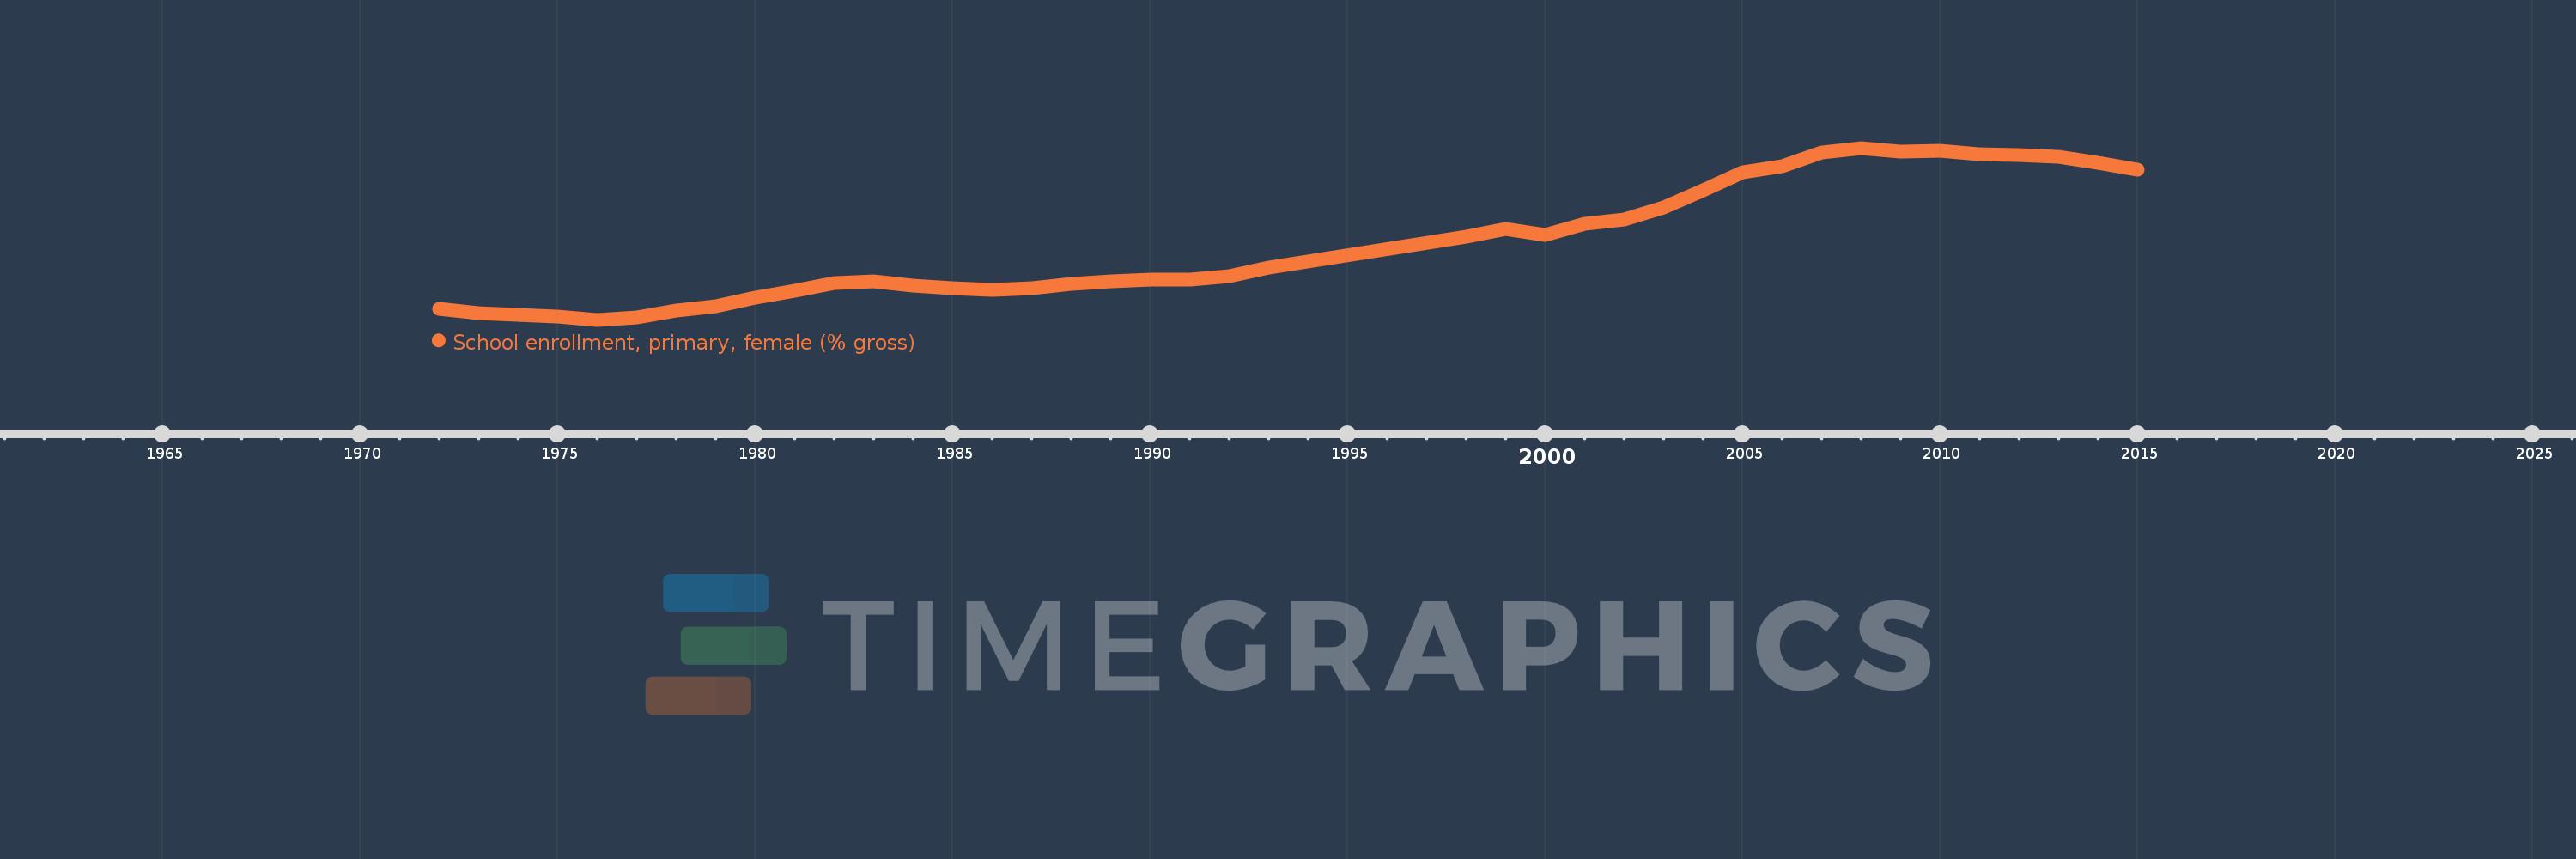
School enrollment, primary, female (% gross)
2015,2014,2013,2012,2011,2010,2009,2008,2007,2006,2005,2004,2003,2002,2001,2000,1999,1998,1993,1992,1991,1990,1989,1988,1987,1986,1985,1984,1983,1982,1981,1980,1979,1978,1977,1976,1975,1974,1973,1972
This statistics in other country:
AfghanistanAlbaniaAlgeriaAndorraAngolaAntigua and BarbudaArab WorldArgentinaArmeniaArubaAustraliaAustriaAzerbaijanBahamas, TheBahrainBangladeshBarbadosBelarusBelgiumBelizeBeninBermudaBhutanBoliviaBosnia and HerzegovinaBotswanaBrazilBrunei DarussalamBulgariaBurkina FasoBurundiCabo VerdeCambodiaCameroonCanadaCaribbean small statesCentral African RepublicCentral Europe and the BalticsChadChileChinaColombiaComorosCongo, Dem. Rep.Congo, Rep.Costa RicaCote d'IvoireCroatiaCubaCuracaoCyprusCzech RepublicDenmarkDjiboutiDominicaDominican RepublicEarly-demographic dividendEast Asia & PacificEast Asia & Pacific (excluding high income)East Asia & Pacific (IDA & IBRD countries)EcuadorEgypt, Arab Rep.El SalvadorEquatorial GuineaEritreaEstoniaEthiopiaEuro areaEurope & Central AsiaEurope & Central Asia (excluding high income)Europe & Central Asia (IDA & IBRD countries)European UnionFijiFinlandFragile and conflict affected situationsFranceGabonGambia, TheGeorgiaGermanyGhanaGreeceGrenadaGuatemalaGuineaGuinea-BissauGuyanaHaitiHeavily indebted poor countries (HIPC)High incomeHondurasHong Kong SAR, ChinaHungaryIBRD onlyIcelandIDA & IBRD totalIDA blendIDA onlyIDA totalIndiaIndonesiaIran, Islamic Rep.IraqIrelandIsraelItalyJamaicaJapanJordanKazakhstanKenyaKiribatiKorea, Dem. People’s Rep.Korea, Rep.KuwaitKyrgyz RepublicLao PDRLate-demographic dividendLatin America & Caribbean Latin America & Caribbean (excluding high income)Latin America & the Caribbean (IDA & IBRD countries)LatviaLeast developed countries: UN classificationLebanonLesothoLiberiaLibyaLiechtensteinLithuaniaLow & middle incomeLow incomeLower middle incomeLuxembourgMacao SAR, ChinaMacedonia, FYRMadagascarMalawiMaldivesMaliMaltaMarshall IslandsMauritaniaMauritiusMexicoMicronesia, Fed. Sts.Middle East & North AfricaMiddle East & North Africa (excluding high income)Middle East & North Africa (IDA & IBRD countries)Middle incomeMoldovaMongoliaMontenegroMoroccoMozambiqueMyanmarNamibiaNauruNepalNetherlandsNew ZealandNicaraguaNigerNigeriaNorth AmericaNorwayOECD membersOmanOther small statesPacific island small statesPakistanPalauPanamaPapua New GuineaParaguayPeruPhilippinesPolandPortugalPost-demographic dividendPre-demographic dividendPuerto RicoQatarRomaniaRussian FederationRwandaSamoaSan MarinoSao Tome and PrincipeSaudi ArabiaSenegalSerbiaSeychellesSierra LeoneSlovak RepublicSloveniaSmall statesSolomon IslandsSomaliaSouth AfricaSouth AsiaSouth Asia (IDA & IBRD)South SudanSpainSri LankaSt. Kitts and NevisSt. LuciaSt. Vincent and the GrenadinesSub-Saharan Africa Sub-Saharan Africa (excluding high income)Sub-Saharan Africa (IDA & IBRD countries)SudanSurinameSwazilandSwedenSwitzerlandSyrian Arab RepublicTajikistanTanzaniaThailandTimor-LesteTogoTongaTrinidad and TobagoTunisiaTurkeyTurkmenistanTuvaluUgandaUkraineUnited Arab EmiratesUnited KingdomUnited StatesUpper middle incomeUruguayUzbekistanVanuatuVenezuela, RBVietnamWest Bank and GazaWorldYemen, Rep.ZambiaZimbabwe Timeline:
This timeline shows a graph from 1972 to 2015 of Rwanda. No data until 1971. Number of actual observations by date: 40.
Source name:
World Development Indicators
Source organization:
United Nations Educational, Scientific, and Cultural Organization (UNESCO) Institute for Statistics.
Categories, topics:
Education, Gender
Last updated:
apr 23, 2017
Indicators value changes by year
Minimum:
49.988
jan 1, 1976
Maximum:
147.545
jan 1, 2008
At the date of observation
Value
Absolute change
Change from previous value
jan 1, 1972
56.374
+56.374
0.0%
jan 1, 1973
53.532
-2.842
-5.04%
jan 1, 1974
52.982
-0.55
-1.03%
jan 1, 1975
51.761
-1.221
-2.3%
jan 1, 1976
49.988
-1.773
-3.43%
jan 1, 1977
51.543
+1.555
3.11%
jan 1, 1978
55.031
+3.489
6.77%
jan 1, 1979
57.652
+2.621
4.76%
jan 1, 1980
62.502
+4.85
8.41%
jan 1, 1981
66.261
+3.759
6.01%
jan 1, 1982
70.848
+4.587
6.92%
jan 1, 1983
71.874
+1.026
1.45%
jan 1, 1984
69.179
-2.695
-3.75%
jan 1, 1985
67.762
-1.418
-2.05%
jan 1, 1986
67.071
-0.691
-1.02%
jan 1, 1987
68.007
+0.937
1.4%
jan 1, 1988
70.217
+2.21
3.25%
jan 1, 1989
71.598
+1.381
1.97%
jan 1, 1990
72.735
+1.138
1.59%
jan 1, 1991
72.7
-0.036
-0.05%
jan 1, 1992
74.888
+2.188
3.01%
jan 1, 1993
79.792
+4.904
6.55%
jan 1, 1998
97.354
+17.562
22.01%
jan 1, 1999
101.413
+4.059
4.17%
jan 1, 2000
98.137
-3.276
-3.23%
jan 1, 2001
104.709
+6.572
6.7%
jan 1, 2002
107.037
+2.329
2.22%
jan 1, 2003
113.562
+6.524
6.1%
jan 1, 2004
123.521
+9.959
8.77%
jan 1, 2005
133.804
+10.283
8.33%
jan 1, 2006
137.077
+3.273
2.45%
jan 1, 2007
144.971
+7.894
5.76%
jan 1, 2008
147.545
+2.574
1.78%
jan 1, 2009
145.423
-2.121
-1.44%
jan 1, 2010
145.783
+0.36
0.25%
jan 1, 2011
144.137
-1.646
-1.13%
jan 1, 2012
143.703
-0.434
-0.3%
jan 1, 2013
142.749
-0.954
-0.66%
jan 1, 2014
139.25
-3.5
-2.45%
jan 1, 2015
135.116
-4.134
-2.97%
Ranking of countries by current statistics by years


Comments: