29
/
en
AIzaSyAYiBZKx7MnpbEhh9jyipgxe19OcubqV5w
April 1, 2024
214769
Norway
NOR
true
2
1
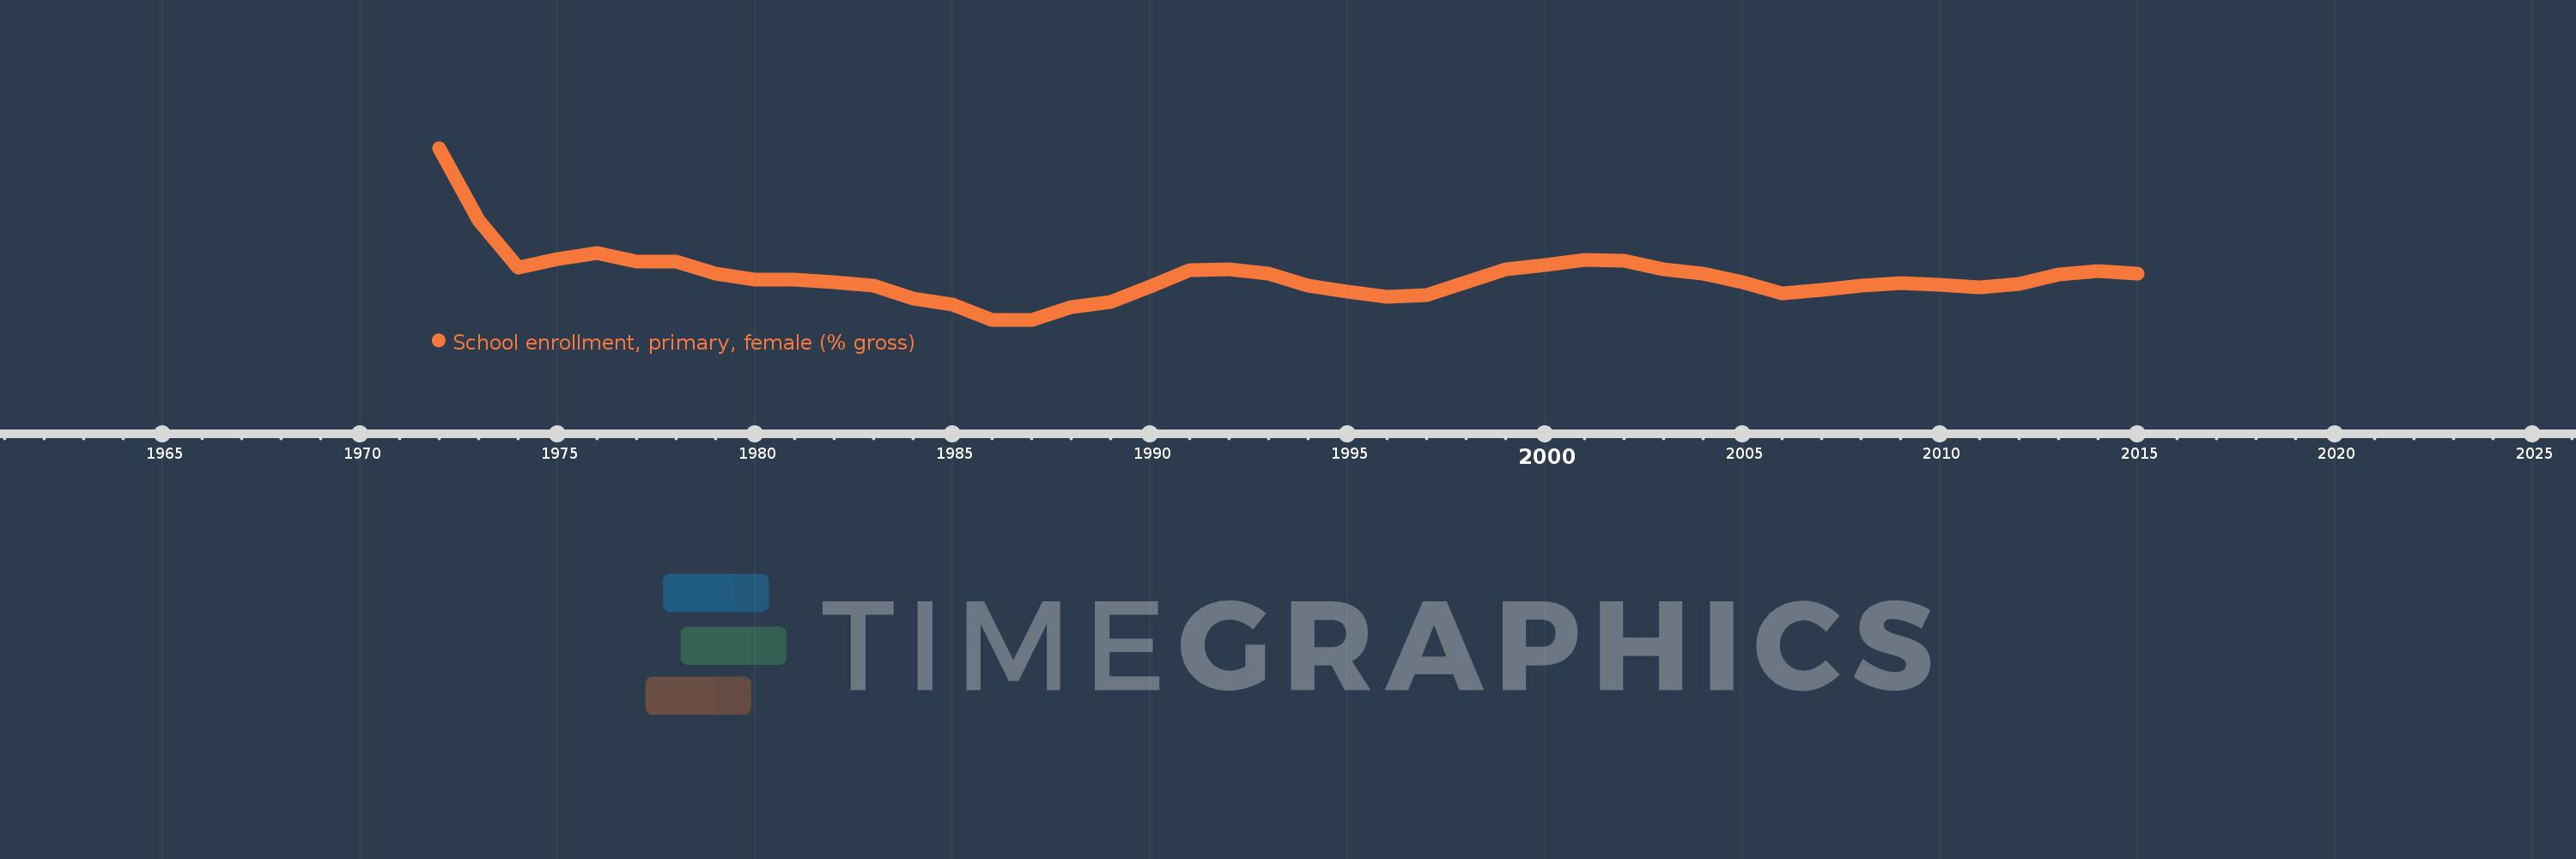
School enrollment, primary, female (% gross)
2015,2014,2013,2012,2011,2010,2009,2008,2007,2006,2005,2004,2003,2002,2001,2000,1999,1998,1997,1996,1995,1994,1993,1992,1991,1990,1989,1988,1987,1986,1985,1984,1983,1982,1981,1980,1979,1978,1977,1976,1975,1974,1973,1972
This statistics in other country:
AfghanistanAlbaniaAlgeriaAndorraAngolaAntigua and BarbudaArab WorldArgentinaArmeniaArubaAustraliaAustriaAzerbaijanBahamas, TheBahrainBangladeshBarbadosBelarusBelgiumBelizeBeninBermudaBhutanBoliviaBosnia and HerzegovinaBotswanaBrazilBrunei DarussalamBulgariaBurkina FasoBurundiCabo VerdeCambodiaCameroonCanadaCaribbean small statesCentral African RepublicCentral Europe and the BalticsChadChileChinaColombiaComorosCongo, Dem. Rep.Congo, Rep.Costa RicaCote d'IvoireCroatiaCubaCuracaoCyprusCzech RepublicDenmarkDjiboutiDominicaDominican RepublicEarly-demographic dividendEast Asia & PacificEast Asia & Pacific (excluding high income)East Asia & Pacific (IDA & IBRD countries)EcuadorEgypt, Arab Rep.El SalvadorEquatorial GuineaEritreaEstoniaEthiopiaEuro areaEurope & Central AsiaEurope & Central Asia (excluding high income)Europe & Central Asia (IDA & IBRD countries)European UnionFijiFinlandFragile and conflict affected situationsFranceGabonGambia, TheGeorgiaGermanyGhanaGreeceGrenadaGuatemalaGuineaGuinea-BissauGuyanaHaitiHeavily indebted poor countries (HIPC)High incomeHondurasHong Kong SAR, ChinaHungaryIBRD onlyIcelandIDA & IBRD totalIDA blendIDA onlyIDA totalIndiaIndonesiaIran, Islamic Rep.IraqIrelandIsraelItalyJamaicaJapanJordanKazakhstanKenyaKiribatiKorea, Dem. People’s Rep.Korea, Rep.KuwaitKyrgyz RepublicLao PDRLate-demographic dividendLatin America & Caribbean Latin America & Caribbean (excluding high income)Latin America & the Caribbean (IDA & IBRD countries)LatviaLeast developed countries: UN classificationLebanonLesothoLiberiaLibyaLiechtensteinLithuaniaLow & middle incomeLow incomeLower middle incomeLuxembourgMacao SAR, ChinaMacedonia, FYRMadagascarMalawiMaldivesMaliMaltaMarshall IslandsMauritaniaMauritiusMexicoMicronesia, Fed. Sts.Middle East & North AfricaMiddle East & North Africa (excluding high income)Middle East & North Africa (IDA & IBRD countries)Middle incomeMoldovaMongoliaMontenegroMoroccoMozambiqueMyanmarNamibiaNauruNepalNetherlandsNew ZealandNicaraguaNigerNigeriaNorth AmericaNorwayOECD membersOmanOther small statesPacific island small statesPakistanPalauPanamaPapua New GuineaParaguayPeruPhilippinesPolandPortugalPost-demographic dividendPre-demographic dividendPuerto RicoQatarRomaniaRussian FederationRwandaSamoaSan MarinoSao Tome and PrincipeSaudi ArabiaSenegalSerbiaSeychellesSierra LeoneSlovak RepublicSloveniaSmall statesSolomon IslandsSomaliaSouth AfricaSouth AsiaSouth Asia (IDA & IBRD)South SudanSpainSri LankaSt. Kitts and NevisSt. LuciaSt. Vincent and the GrenadinesSub-Saharan Africa Sub-Saharan Africa (excluding high income)Sub-Saharan Africa (IDA & IBRD countries)SudanSurinameSwazilandSwedenSwitzerlandSyrian Arab RepublicTajikistanTanzaniaThailandTimor-LesteTogoTongaTrinidad and TobagoTunisiaTurkeyTurkmenistanTuvaluUgandaUkraineUnited Arab EmiratesUnited KingdomUnited StatesUpper middle incomeUruguayUzbekistanVanuatuVenezuela, RBVietnamWest Bank and GazaWorldYemen, Rep.ZambiaZimbabwe Timeline:
This timeline shows a graph from 1972 to 2015 of Norway. No data until 1971. Number of actual observations by date: 44.
Source name:
World Development Indicators
Source organization:
United Nations Educational, Scientific, and Cultural Organization (UNESCO) Institute for Statistics.
Categories, topics:
Education, Gender
Last updated:
apr 23, 2017
Indicators value changes by year
Minimum:
96.853
jan 1, 1987
Maximum:
108.938
jan 1, 1972
At the date of observation
Value
Absolute change
Change from previous value
jan 1, 1972
108.938
+108.938
0.0%
jan 1, 1973
103.867
-5.071
-4.65%
jan 1, 1974
100.536
-3.331
-3.21%
jan 1, 1975
101.127
+0.591
0.59%
jan 1, 1976
101.531
+0.404
0.4%
jan 1, 1977
100.955
-0.576
-0.57%
jan 1, 1978
100.927
-0.028
-0.03%
jan 1, 1979
100.103
-0.824
-0.82%
jan 1, 1980
99.66
-0.443
-0.44%
jan 1, 1981
99.693
+0.033
0.03%
jan 1, 1982
99.506
-0.187
-0.19%
jan 1, 1983
99.24
-0.266
-0.27%
jan 1, 1984
98.355
-0.885
-0.89%
jan 1, 1985
97.921
-0.434
-0.44%
jan 1, 1986
96.859
-1.062
-1.08%
jan 1, 1987
96.853
-0.006
-0.01%
jan 1, 1988
97.723
+0.869
0.9%
jan 1, 1989
98.119
+0.396
0.41%
jan 1, 1990
99.165
+1.046
1.07%
jan 1, 1991
100.316
+1.152
1.16%
jan 1, 1992
100.384
+0.068
0.07%
jan 1, 1993
100.094
-0.29
-0.29%
jan 1, 1994
99.244
-0.85
-0.85%
jan 1, 1995
98.827
-0.417
-0.42%
jan 1, 1996
98.45
-0.377
-0.38%
jan 1, 1997
98.617
+0.167
0.17%
jan 1, 1998
99.508
+0.891
0.9%
jan 1, 1999
100.413
+0.905
0.91%
jan 1, 2000
100.713
+0.3
0.3%
jan 1, 2001
101.041
+0.328
0.33%
jan 1, 2002
101.017
-0.024
-0.02%
jan 1, 2003
100.386
-0.631
-0.62%
jan 1, 2004
100.082
-0.304
-0.3%
jan 1, 2005
99.51
-0.572
-0.57%
jan 1, 2006
98.729
-0.78
-0.78%
jan 1, 2007
98.973
+0.243
0.25%
jan 1, 2008
99.237
+0.264
0.27%
jan 1, 2009
99.444
+0.207
0.21%
jan 1, 2010
99.283
-0.161
-0.16%
jan 1, 2011
99.121
-0.162
-0.16%
jan 1, 2012
99.35
+0.229
0.23%
jan 1, 2013
100.031
+0.681
0.69%
jan 1, 2014
100.289
+0.257
0.26%
jan 1, 2015
100.121
-0.168
-0.17%
Ranking of countries by current statistics by years


Comments: