29
/
en
AIzaSyAYiBZKx7MnpbEhh9jyipgxe19OcubqV5w
April 1, 2024
164229
Japan
JPN
true
2
1
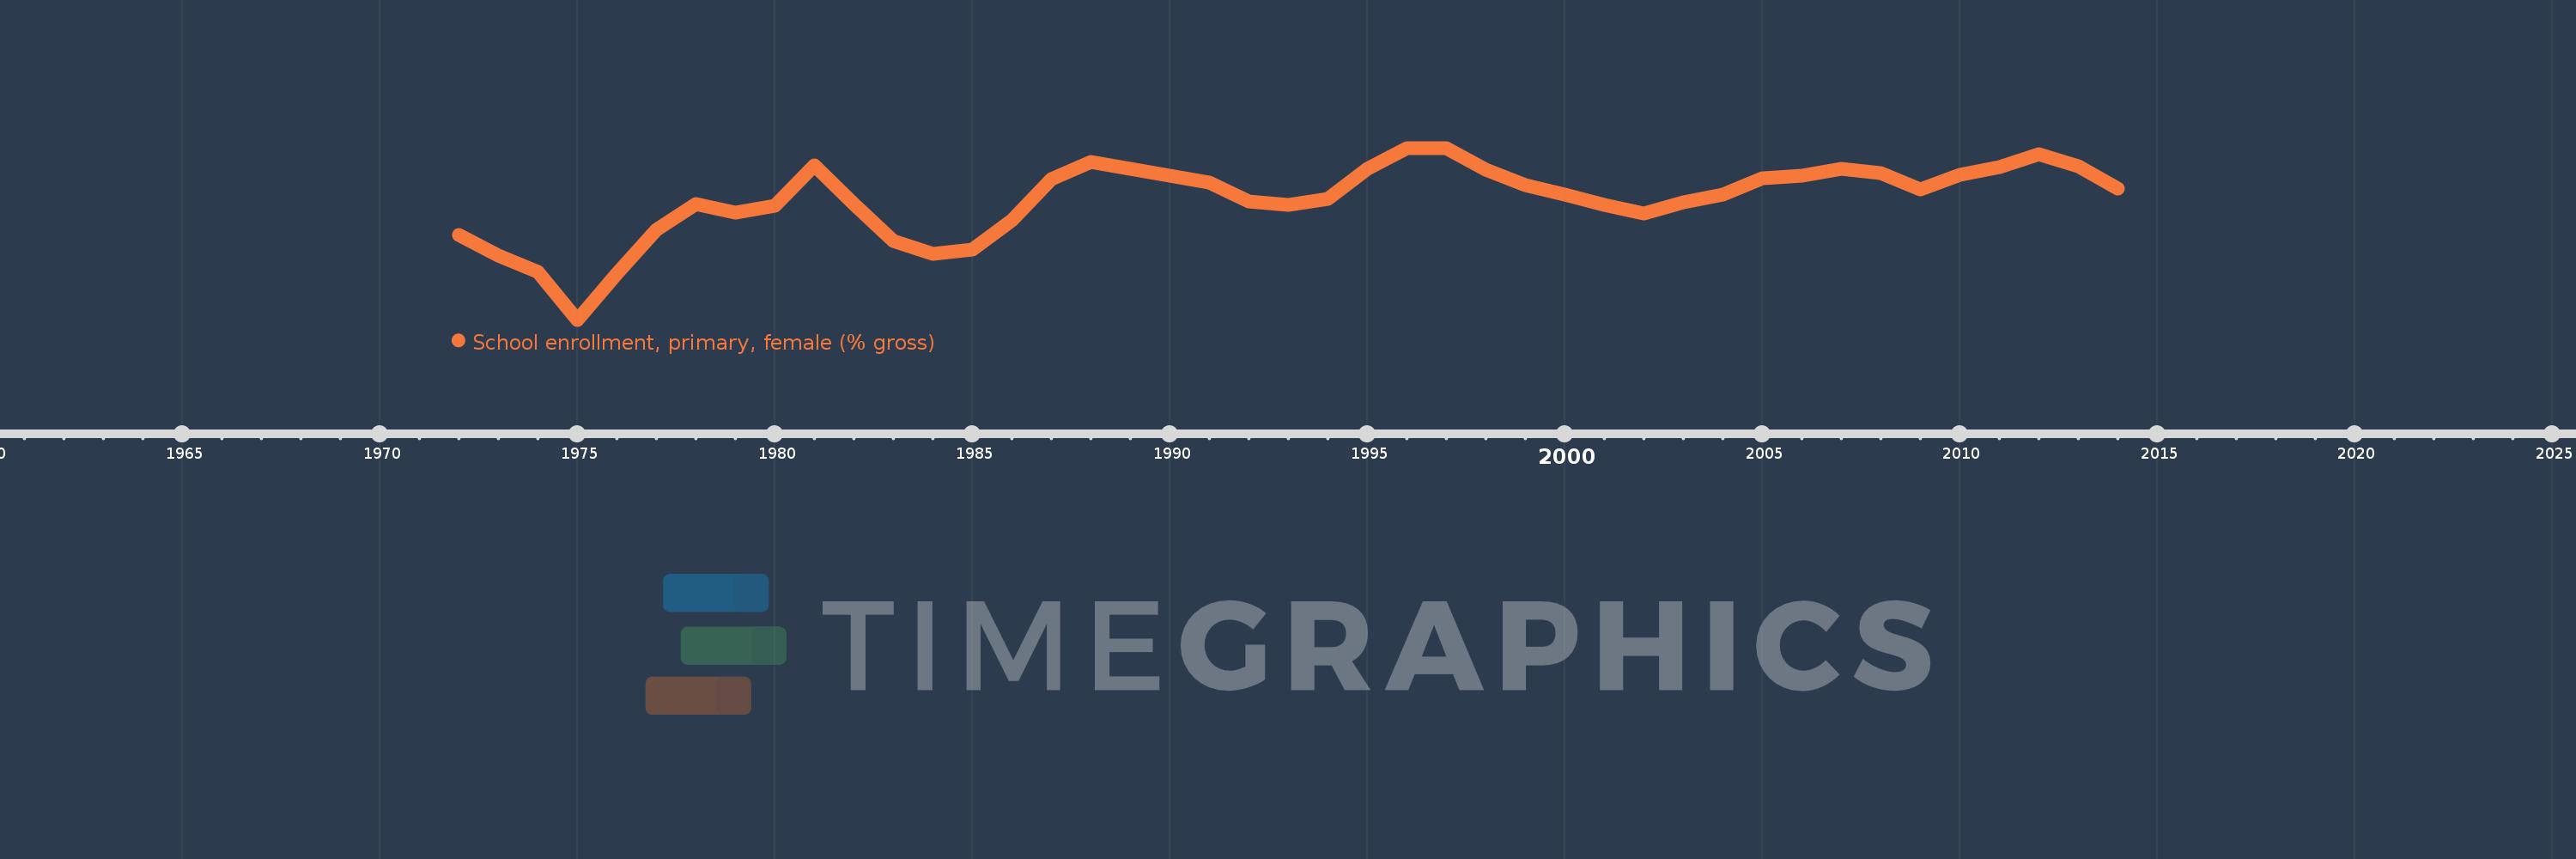
School enrollment, primary, female (% gross)
2014,2013,2012,2011,2010,2009,2008,2007,2006,2005,2004,2003,2002,2001,2000,1999,1998,1997,1996,1995,1994,1993,1992,1991,1990,1989,1988,1987,1986,1985,1984,1983,1982,1981,1980,1979,1978,1977,1976,1975,1974,1973,1972
This statistics in other country:
AfghanistanAlbaniaAlgeriaAndorraAngolaAntigua and BarbudaArab WorldArgentinaArmeniaArubaAustraliaAustriaAzerbaijanBahamas, TheBahrainBangladeshBarbadosBelarusBelgiumBelizeBeninBermudaBhutanBoliviaBosnia and HerzegovinaBotswanaBrazilBrunei DarussalamBulgariaBurkina FasoBurundiCabo VerdeCambodiaCameroonCanadaCaribbean small statesCentral African RepublicCentral Europe and the BalticsChadChileChinaColombiaComorosCongo, Dem. Rep.Congo, Rep.Costa RicaCote d'IvoireCroatiaCubaCuracaoCyprusCzech RepublicDenmarkDjiboutiDominicaDominican RepublicEarly-demographic dividendEast Asia & PacificEast Asia & Pacific (excluding high income)East Asia & Pacific (IDA & IBRD countries)EcuadorEgypt, Arab Rep.El SalvadorEquatorial GuineaEritreaEstoniaEthiopiaEuro areaEurope & Central AsiaEurope & Central Asia (excluding high income)Europe & Central Asia (IDA & IBRD countries)European UnionFijiFinlandFragile and conflict affected situationsFranceGabonGambia, TheGeorgiaGermanyGhanaGreeceGrenadaGuatemalaGuineaGuinea-BissauGuyanaHaitiHeavily indebted poor countries (HIPC)High incomeHondurasHong Kong SAR, ChinaHungaryIBRD onlyIcelandIDA & IBRD totalIDA blendIDA onlyIDA totalIndiaIndonesiaIran, Islamic Rep.IraqIrelandIsraelItalyJamaicaJapanJordanKazakhstanKenyaKiribatiKorea, Dem. People’s Rep.Korea, Rep.KuwaitKyrgyz RepublicLao PDRLate-demographic dividendLatin America & Caribbean Latin America & Caribbean (excluding high income)Latin America & the Caribbean (IDA & IBRD countries)LatviaLeast developed countries: UN classificationLebanonLesothoLiberiaLibyaLiechtensteinLithuaniaLow & middle incomeLow incomeLower middle incomeLuxembourgMacao SAR, ChinaMacedonia, FYRMadagascarMalawiMaldivesMaliMaltaMarshall IslandsMauritaniaMauritiusMexicoMicronesia, Fed. Sts.Middle East & North AfricaMiddle East & North Africa (excluding high income)Middle East & North Africa (IDA & IBRD countries)Middle incomeMoldovaMongoliaMontenegroMoroccoMozambiqueMyanmarNamibiaNauruNepalNetherlandsNew ZealandNicaraguaNigerNigeriaNorth AmericaNorwayOECD membersOmanOther small statesPacific island small statesPakistanPalauPanamaPapua New GuineaParaguayPeruPhilippinesPolandPortugalPost-demographic dividendPre-demographic dividendPuerto RicoQatarRomaniaRussian FederationRwandaSamoaSan MarinoSao Tome and PrincipeSaudi ArabiaSenegalSerbiaSeychellesSierra LeoneSlovak RepublicSloveniaSmall statesSolomon IslandsSomaliaSouth AfricaSouth AsiaSouth Asia (IDA & IBRD)South SudanSpainSri LankaSt. Kitts and NevisSt. LuciaSt. Vincent and the GrenadinesSub-Saharan Africa Sub-Saharan Africa (excluding high income)Sub-Saharan Africa (IDA & IBRD countries)SudanSurinameSwazilandSwedenSwitzerlandSyrian Arab RepublicTajikistanTanzaniaThailandTimor-LesteTogoTongaTrinidad and TobagoTunisiaTurkeyTurkmenistanTuvaluUgandaUkraineUnited Arab EmiratesUnited KingdomUnited StatesUpper middle incomeUruguayUzbekistanVanuatuVenezuela, RBVietnamWest Bank and GazaWorldYemen, Rep.ZambiaZimbabwe Timeline:
This timeline shows a graph from 1972 to 2014 of Japan. No data until 1971. Number of actual observations by date: 43.
Source name:
World Development Indicators
Source organization:
United Nations Educational, Scientific, and Cultural Organization (UNESCO) Institute for Statistics.
Categories, topics:
Education, Gender
Last updated:
apr 23, 2017
Indicators value changes by year
Maximum:
102.766
jan 1, 1996
At the date of observation
Value
Absolute change
Change from previous value
jan 1, 1972
100.047
+100.047
0.0%
jan 1, 1973
99.403
-0.644
-0.64%
jan 1, 1974
98.88
-0.524
-0.53%
jan 1, 1975
97.39
-1.489
-1.51%
jan 1, 1976
98.824
+1.434
1.47%
jan 1, 1977
100.212
+1.387
1.4%
jan 1, 1978
101.01
+0.799
0.8%
jan 1, 1979
100.739
-0.271
-0.27%
jan 1, 1980
100.961
+0.223
0.22%
jan 1, 1981
102.21
+1.248
1.24%
jan 1, 1982
101.018
-1.192
-1.17%
jan 1, 1983
99.868
-1.15
-1.14%
jan 1, 1984
99.44
-0.428
-0.43%
jan 1, 1985
99.588
+0.148
0.15%
jan 1, 1986
100.5
+0.911
0.92%
jan 1, 1987
101.788
+1.288
1.28%
jan 1, 1988
102.335
+0.548
0.54%
jan 1, 1989
102.111
-0.225
-0.22%
jan 1, 1990
101.895
-0.216
-0.21%
jan 1, 1991
101.679
-0.216
-0.21%
jan 1, 1992
101.104
-0.575
-0.57%
jan 1, 1993
100.991
-0.113
-0.11%
jan 1, 1994
101.161
+0.171
0.17%
jan 1, 1995
102.116
+0.954
0.94%
jan 1, 1996
102.766
+0.651
0.64%
jan 1, 1997
102.764
-0.003
0.0%
jan 1, 1998
102.084
-0.68
-0.66%
jan 1, 1999
101.613
-0.471
-0.46%
jan 1, 2000
101.304
-0.309
-0.3%
jan 1, 2001
100.99
-0.314
-0.31%
jan 1, 2002
100.714
-0.276
-0.27%
jan 1, 2003
101.076
+0.362
0.36%
jan 1, 2004
101.319
+0.243
0.24%
jan 1, 2005
101.824
+0.505
0.5%
jan 1, 2006
101.908
+0.083
0.08%
jan 1, 2007
102.113
+0.206
0.2%
jan 1, 2008
101.981
-0.133
-0.13%
jan 1, 2009
101.472
-0.509
-0.5%
jan 1, 2010
101.931
+0.459
0.45%
jan 1, 2011
102.158
+0.227
0.22%
jan 1, 2012
102.564
+0.406
0.4%
jan 1, 2013
102.206
-0.358
-0.35%
jan 1, 2014
101.485
-0.721
-0.71%
Ranking of countries by current statistics by years


Comments: