29
/
en
AIzaSyAYiBZKx7MnpbEhh9jyipgxe19OcubqV5w
April 1, 2024
55141
Post-demographic dividend
PST
false
2
1
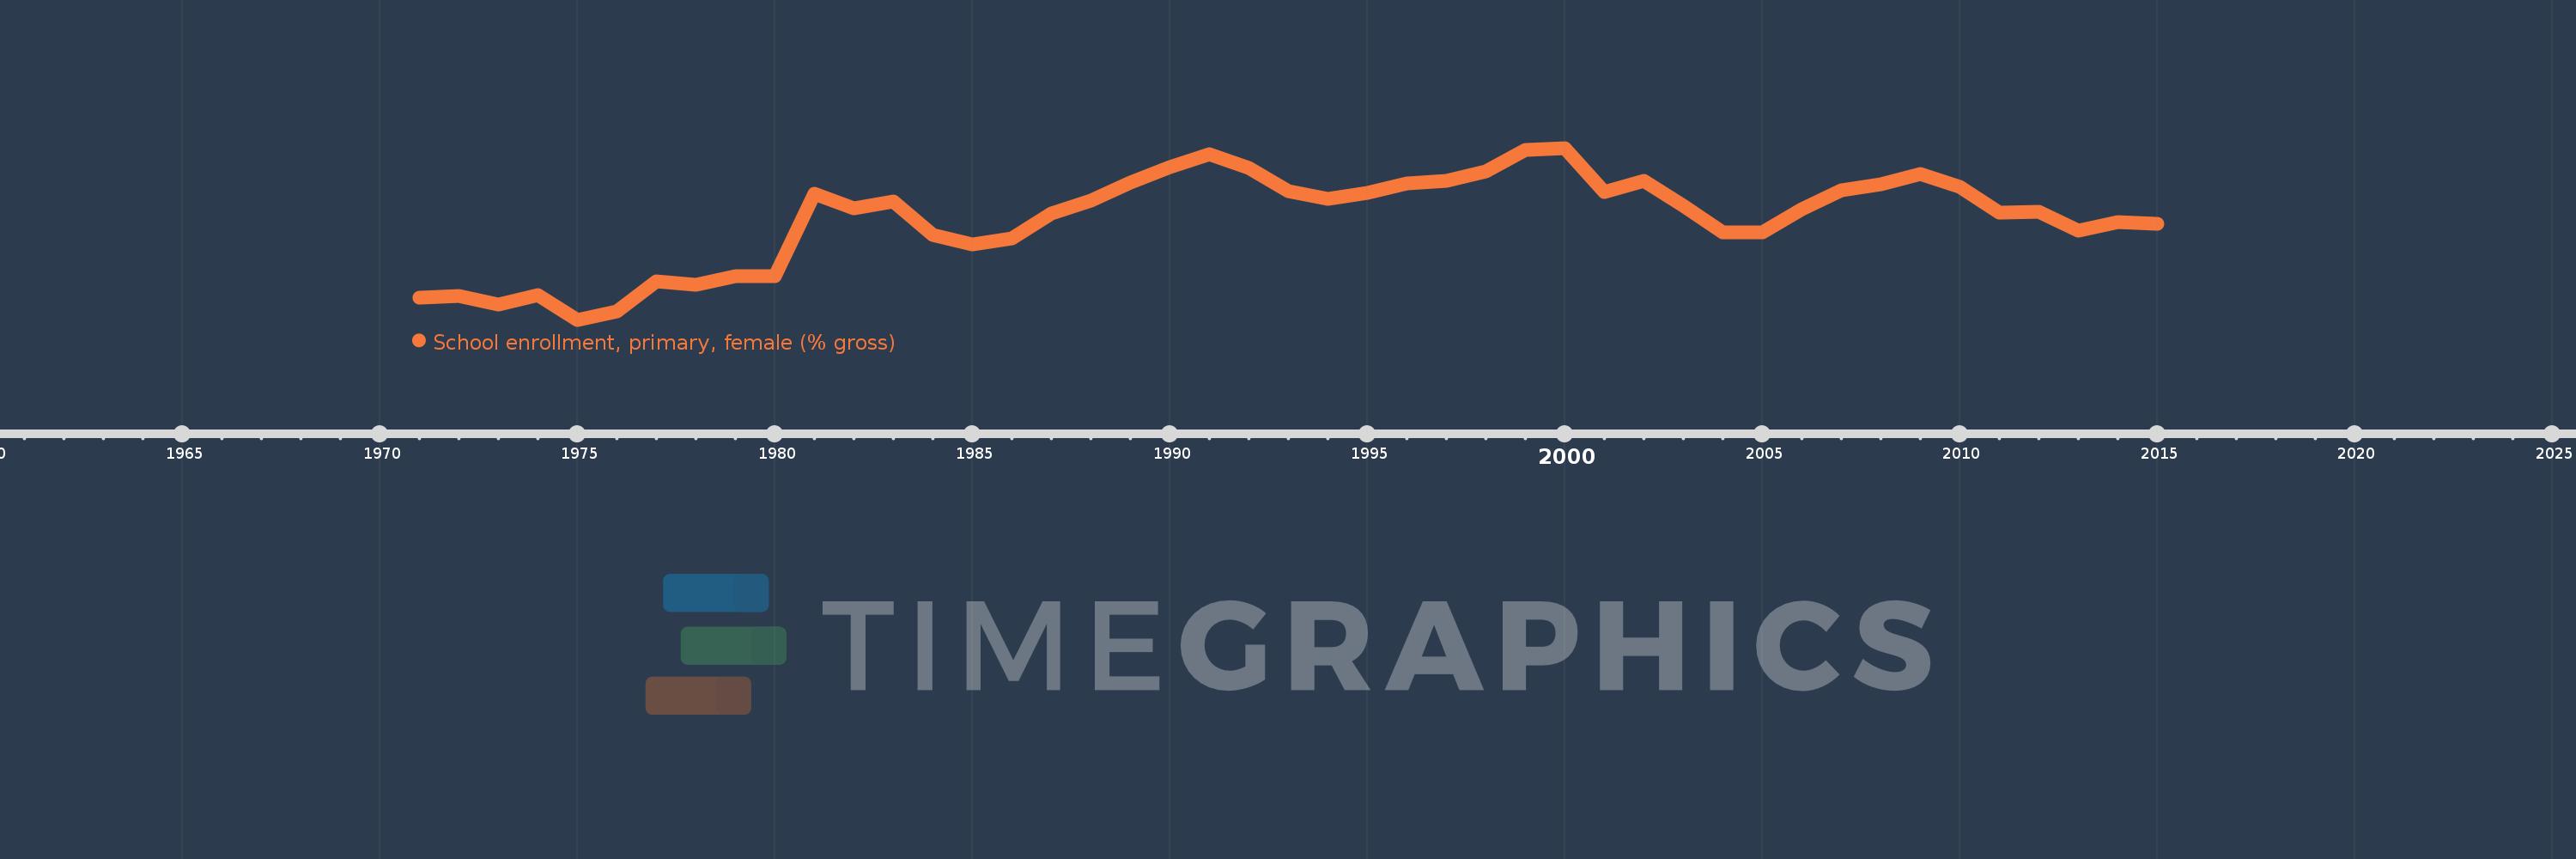
School enrollment, primary, female (% gross)
2015,2014,2013,2012,2011,2010,2009,2008,2007,2006,2005,2004,2003,2002,2001,2000,1999,1998,1997,1996,1995,1994,1993,1992,1991,1990,1989,1988,1987,1986,1985,1984,1983,1982,1981,1980,1979,1978,1977,1976,1975,1974,1973,1972,1971
This statistics in other country:
AfghanistanAlbaniaAlgeriaAndorraAngolaAntigua and BarbudaArab WorldArgentinaArmeniaArubaAustraliaAustriaAzerbaijanBahamas, TheBahrainBangladeshBarbadosBelarusBelgiumBelizeBeninBermudaBhutanBoliviaBosnia and HerzegovinaBotswanaBrazilBrunei DarussalamBulgariaBurkina FasoBurundiCabo VerdeCambodiaCameroonCanadaCaribbean small statesCentral African RepublicCentral Europe and the BalticsChadChileChinaColombiaComorosCongo, Dem. Rep.Congo, Rep.Costa RicaCote d'IvoireCroatiaCubaCuracaoCyprusCzech RepublicDenmarkDjiboutiDominicaDominican RepublicEarly-demographic dividendEast Asia & PacificEast Asia & Pacific (excluding high income)East Asia & Pacific (IDA & IBRD countries)EcuadorEgypt, Arab Rep.El SalvadorEquatorial GuineaEritreaEstoniaEthiopiaEuro areaEurope & Central AsiaEurope & Central Asia (excluding high income)Europe & Central Asia (IDA & IBRD countries)European UnionFijiFinlandFragile and conflict affected situationsFranceGabonGambia, TheGeorgiaGermanyGhanaGreeceGrenadaGuatemalaGuineaGuinea-BissauGuyanaHaitiHeavily indebted poor countries (HIPC)High incomeHondurasHong Kong SAR, ChinaHungaryIBRD onlyIcelandIDA & IBRD totalIDA blendIDA onlyIDA totalIndiaIndonesiaIran, Islamic Rep.IraqIrelandIsraelItalyJamaicaJapanJordanKazakhstanKenyaKiribatiKorea, Dem. People’s Rep.Korea, Rep.KuwaitKyrgyz RepublicLao PDRLate-demographic dividendLatin America & Caribbean Latin America & Caribbean (excluding high income)Latin America & the Caribbean (IDA & IBRD countries)LatviaLeast developed countries: UN classificationLebanonLesothoLiberiaLibyaLiechtensteinLithuaniaLow & middle incomeLow incomeLower middle incomeLuxembourgMacao SAR, ChinaMacedonia, FYRMadagascarMalawiMaldivesMaliMaltaMarshall IslandsMauritaniaMauritiusMexicoMicronesia, Fed. Sts.Middle East & North AfricaMiddle East & North Africa (excluding high income)Middle East & North Africa (IDA & IBRD countries)Middle incomeMoldovaMongoliaMontenegroMoroccoMozambiqueMyanmarNamibiaNauruNepalNetherlandsNew ZealandNicaraguaNigerNigeriaNorth AmericaNorwayOECD membersOmanOther small statesPacific island small statesPakistanPalauPanamaPapua New GuineaParaguayPeruPhilippinesPolandPortugalPost-demographic dividendPre-demographic dividendPuerto RicoQatarRomaniaRussian FederationRwandaSamoaSan MarinoSao Tome and PrincipeSaudi ArabiaSenegalSerbiaSeychellesSierra LeoneSlovak RepublicSloveniaSmall statesSolomon IslandsSomaliaSouth AfricaSouth AsiaSouth Asia (IDA & IBRD)South SudanSpainSri LankaSt. Kitts and NevisSt. LuciaSt. Vincent and the GrenadinesSub-Saharan Africa Sub-Saharan Africa (excluding high income)Sub-Saharan Africa (IDA & IBRD countries)SudanSurinameSwazilandSwedenSwitzerlandSyrian Arab RepublicTajikistanTanzaniaThailandTimor-LesteTogoTongaTrinidad and TobagoTunisiaTurkeyTurkmenistanTuvaluUgandaUkraineUnited Arab EmiratesUnited KingdomUnited StatesUpper middle incomeUruguayUzbekistanVanuatuVenezuela, RBVietnamWest Bank and GazaWorldYemen, Rep.ZambiaZimbabwe Timeline:
This timeline shows a graph from 1971 to 2015 of Post-demographic dividend. No data until 1970. Number of actual observations by date: 45.
Source name:
World Development Indicators
Source organization:
United Nations Educational, Scientific, and Cultural Organization (UNESCO) Institute for Statistics.
Categories, topics:
Education, Gender
Last updated:
apr 23, 2017
Indicators value changes by year
Minimum:
98.994
jan 1, 1975
Maximum:
104.055
jan 1, 2000
At the date of observation
Value
Absolute change
Change from previous value
jan 1, 1971
99.647
+99.647
0.0%
jan 1, 1972
99.698
+0.052
0.05%
jan 1, 1973
99.444
-0.254
-0.25%
jan 1, 1974
99.729
+0.284
0.29%
jan 1, 1975
98.994
-0.735
-0.74%
jan 1, 1976
99.249
+0.255
0.26%
jan 1, 1977
100.132
+0.883
0.89%
jan 1, 1978
100.012
-0.12
-0.12%
jan 1, 1979
100.272
+0.26
0.26%
jan 1, 1980
100.266
-0.006
-0.01%
jan 1, 1981
102.695
+2.429
2.42%
jan 1, 1982
102.268
-0.427
-0.42%
jan 1, 1983
102.48
+0.212
0.21%
jan 1, 1984
101.482
-0.998
-0.97%
jan 1, 1985
101.201
-0.281
-0.28%
jan 1, 1986
101.396
+0.195
0.19%
jan 1, 1987
102.119
+0.723
0.71%
jan 1, 1988
102.498
+0.379
0.37%
jan 1, 1989
103.028
+0.53
0.52%
jan 1, 1990
103.49
+0.462
0.45%
jan 1, 1991
103.872
+0.382
0.37%
jan 1, 1992
103.474
-0.398
-0.38%
jan 1, 1993
102.793
-0.681
-0.66%
jan 1, 1994
102.561
-0.232
-0.23%
jan 1, 1995
102.73
+0.169
0.16%
jan 1, 1996
103.008
+0.278
0.27%
jan 1, 1997
103.077
+0.069
0.07%
jan 1, 1998
103.357
+0.28
0.27%
jan 1, 1999
104.004
+0.646
0.63%
jan 1, 2000
104.055
+0.052
0.05%
jan 1, 2001
102.754
-1.302
-1.25%
jan 1, 2002
103.077
+0.323
0.31%
jan 1, 2003
102.347
-0.73
-0.71%
jan 1, 2004
101.555
-0.792
-0.77%
jan 1, 2005
101.573
+0.018
0.02%
jan 1, 2006
102.258
+0.686
0.68%
jan 1, 2007
102.795
+0.536
0.52%
jan 1, 2008
102.983
+0.188
0.18%
jan 1, 2009
103.282
+0.3
0.29%
jan 1, 2010
102.915
-0.367
-0.36%
jan 1, 2011
102.146
-0.769
-0.75%
jan 1, 2012
102.175
+0.029
0.03%
jan 1, 2013
101.62
-0.556
-0.54%
jan 1, 2014
101.865
+0.246
0.24%
jan 1, 2015
101.812
-0.053
-0.05%
Ranking of countries by current statistics by years


Comments: