29
/
en
AIzaSyAYiBZKx7MnpbEhh9jyipgxe19OcubqV5w
April 1, 2024
73420
Australia
AUS
true
2
1
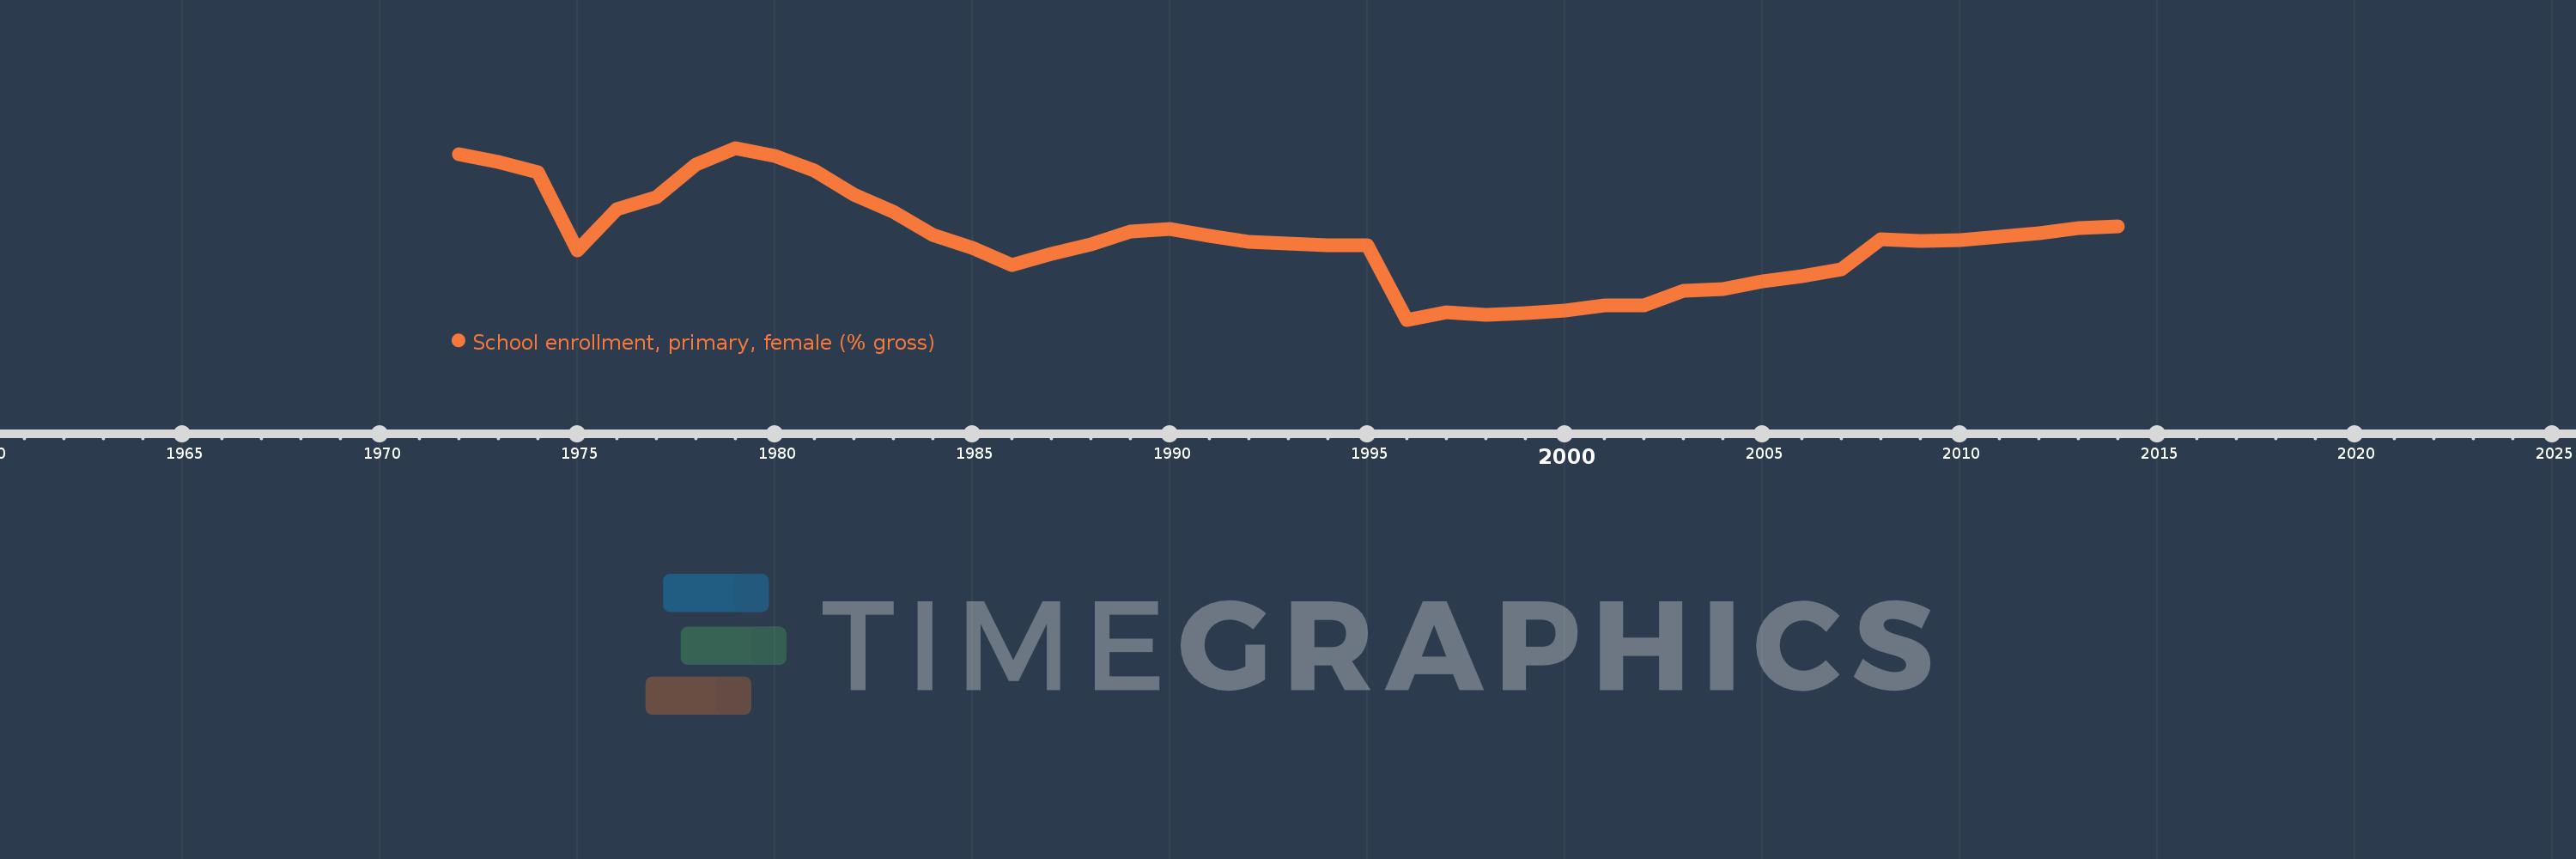
School enrollment, primary, female (% gross)
2014,2013,2012,2011,2010,2009,2008,2007,2006,2005,2004,2003,2002,2001,2000,1999,1998,1997,1996,1995,1994,1993,1992,1991,1990,1989,1988,1987,1986,1985,1984,1983,1982,1981,1980,1979,1978,1977,1976,1975,1974,1973,1972
This statistics in other country:
AfghanistanAlbaniaAlgeriaAndorraAngolaAntigua and BarbudaArab WorldArgentinaArmeniaArubaAustraliaAustriaAzerbaijanBahamas, TheBahrainBangladeshBarbadosBelarusBelgiumBelizeBeninBermudaBhutanBoliviaBosnia and HerzegovinaBotswanaBrazilBrunei DarussalamBulgariaBurkina FasoBurundiCabo VerdeCambodiaCameroonCanadaCaribbean small statesCentral African RepublicCentral Europe and the BalticsChadChileChinaColombiaComorosCongo, Dem. Rep.Congo, Rep.Costa RicaCote d'IvoireCroatiaCubaCuracaoCyprusCzech RepublicDenmarkDjiboutiDominicaDominican RepublicEarly-demographic dividendEast Asia & PacificEast Asia & Pacific (excluding high income)East Asia & Pacific (IDA & IBRD countries)EcuadorEgypt, Arab Rep.El SalvadorEquatorial GuineaEritreaEstoniaEthiopiaEuro areaEurope & Central AsiaEurope & Central Asia (excluding high income)Europe & Central Asia (IDA & IBRD countries)European UnionFijiFinlandFragile and conflict affected situationsFranceGabonGambia, TheGeorgiaGermanyGhanaGreeceGrenadaGuatemalaGuineaGuinea-BissauGuyanaHaitiHeavily indebted poor countries (HIPC)High incomeHondurasHong Kong SAR, ChinaHungaryIBRD onlyIcelandIDA & IBRD totalIDA blendIDA onlyIDA totalIndiaIndonesiaIran, Islamic Rep.IraqIrelandIsraelItalyJamaicaJapanJordanKazakhstanKenyaKiribatiKorea, Dem. People’s Rep.Korea, Rep.KuwaitKyrgyz RepublicLao PDRLate-demographic dividendLatin America & Caribbean Latin America & Caribbean (excluding high income)Latin America & the Caribbean (IDA & IBRD countries)LatviaLeast developed countries: UN classificationLebanonLesothoLiberiaLibyaLiechtensteinLithuaniaLow & middle incomeLow incomeLower middle incomeLuxembourgMacao SAR, ChinaMacedonia, FYRMadagascarMalawiMaldivesMaliMaltaMarshall IslandsMauritaniaMauritiusMexicoMicronesia, Fed. Sts.Middle East & North AfricaMiddle East & North Africa (excluding high income)Middle East & North Africa (IDA & IBRD countries)Middle incomeMoldovaMongoliaMontenegroMoroccoMozambiqueMyanmarNamibiaNauruNepalNetherlandsNew ZealandNicaraguaNigerNigeriaNorth AmericaNorwayOECD membersOmanOther small statesPacific island small statesPakistanPalauPanamaPapua New GuineaParaguayPeruPhilippinesPolandPortugalPost-demographic dividendPre-demographic dividendPuerto RicoQatarRomaniaRussian FederationRwandaSamoaSan MarinoSao Tome and PrincipeSaudi ArabiaSenegalSerbiaSeychellesSierra LeoneSlovak RepublicSloveniaSmall statesSolomon IslandsSomaliaSouth AfricaSouth AsiaSouth Asia (IDA & IBRD)South SudanSpainSri LankaSt. Kitts and NevisSt. LuciaSt. Vincent and the GrenadinesSub-Saharan Africa Sub-Saharan Africa (excluding high income)Sub-Saharan Africa (IDA & IBRD countries)SudanSurinameSwazilandSwedenSwitzerlandSyrian Arab RepublicTajikistanTanzaniaThailandTimor-LesteTogoTongaTrinidad and TobagoTunisiaTurkeyTurkmenistanTuvaluUgandaUkraineUnited Arab EmiratesUnited KingdomUnited StatesUpper middle incomeUruguayUzbekistanVanuatuVenezuela, RBVietnamWest Bank and GazaWorldYemen, Rep.ZambiaZimbabwe Timeline:
This timeline shows a graph from 1972 to 2014 of Australia. No data until 1971. Number of actual observations by date: 43.
Source name:
World Development Indicators
Source organization:
United Nations Educational, Scientific, and Cultural Organization (UNESCO) Institute for Statistics.
Categories, topics:
Education, Gender
Last updated:
apr 23, 2017
Indicators value changes by year
Minimum:
100.568
jan 1, 1996
Maximum:
110.979
jan 1, 1979
At the date of observation
Value
Absolute change
Change from previous value
jan 1, 1972
110.604
+110.604
0.0%
jan 1, 1973
110.106
-0.499
-0.45%
jan 1, 1974
109.51
-0.595
-0.54%
jan 1, 1975
104.759
-4.751
-4.34%
jan 1, 1976
107.268
+2.509
2.4%
jan 1, 1977
107.989
+0.721
0.67%
jan 1, 1978
109.969
+1.979
1.83%
jan 1, 1979
110.979
+1.011
0.92%
jan 1, 1980
110.501
-0.478
-0.43%
jan 1, 1981
109.614
-0.887
-0.8%
jan 1, 1982
108.138
-1.476
-1.35%
jan 1, 1983
107.093
-1.044
-0.97%
jan 1, 1984
105.693
-1.4
-1.31%
jan 1, 1985
104.907
-0.786
-0.74%
jan 1, 1986
103.86
-1.047
-1.0%
jan 1, 1987
104.558
+0.698
0.67%
jan 1, 1988
105.111
+0.553
0.53%
jan 1, 1989
105.89
+0.779
0.74%
jan 1, 1990
106.077
+0.186
0.18%
jan 1, 1991
105.657
-0.42
-0.4%
jan 1, 1992
105.315
-0.342
-0.32%
jan 1, 1993
105.206
-0.109
-0.1%
jan 1, 1994
105.087
-0.119
-0.11%
jan 1, 1995
105.08
-0.006
-0.01%
jan 1, 1996
100.568
-4.512
-4.29%
jan 1, 1997
101.031
+0.463
0.46%
jan 1, 1998
100.873
-0.158
-0.16%
jan 1, 1999
100.979
+0.106
0.11%
jan 1, 2000
101.108
+0.129
0.13%
jan 1, 2001
101.441
+0.333
0.33%
jan 1, 2002
101.458
+0.017
0.02%
jan 1, 2003
102.311
+0.854
0.84%
jan 1, 2004
102.404
+0.093
0.09%
jan 1, 2005
102.886
+0.481
0.47%
jan 1, 2006
103.187
+0.302
0.29%
jan 1, 2007
103.641
+0.454
0.44%
jan 1, 2008
105.421
+1.779
1.72%
jan 1, 2009
105.359
-0.061
-0.06%
jan 1, 2010
105.415
+0.056
0.05%
jan 1, 2011
105.606
+0.191
0.18%
jan 1, 2012
105.802
+0.195
0.18%
jan 1, 2013
106.125
+0.323
0.31%
jan 1, 2014
106.237
+0.112
0.11%
Ranking of countries by current statistics by years


Comments: