29
/
en
AIzaSyAYiBZKx7MnpbEhh9jyipgxe19OcubqV5w
April 1, 2024
278236
Uruguay
URY
true
2
1
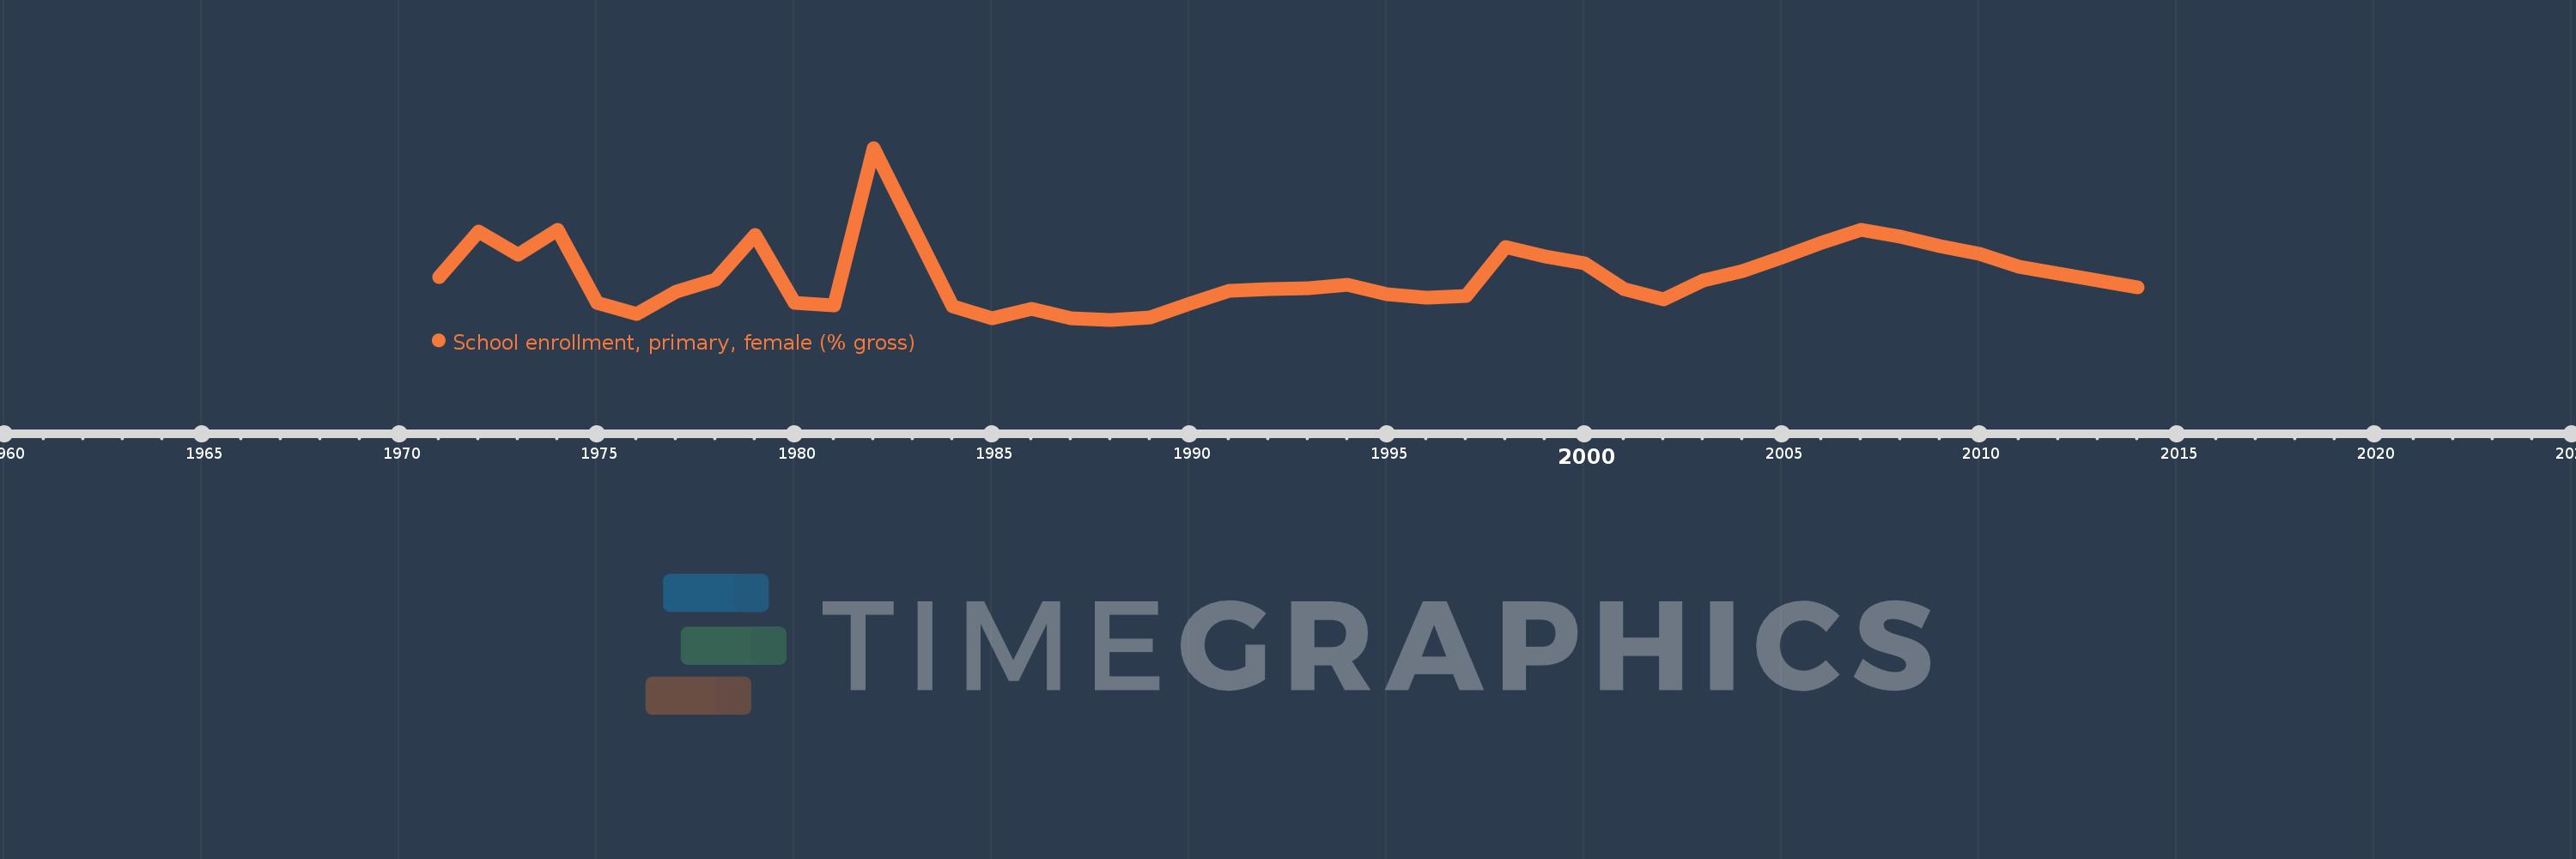
School enrollment, primary, female (% gross)
2014,2011,2010,2009,2008,2007,2006,2005,2004,2003,2002,2001,2000,1999,1998,1997,1996,1995,1994,1993,1992,1991,1990,1989,1988,1987,1986,1985,1984,1982,1981,1980,1979,1978,1977,1976,1975,1974,1973,1972,1971
This statistics in other country:
AfghanistanAlbaniaAlgeriaAndorraAngolaAntigua and BarbudaArab WorldArgentinaArmeniaArubaAustraliaAustriaAzerbaijanBahamas, TheBahrainBangladeshBarbadosBelarusBelgiumBelizeBeninBermudaBhutanBoliviaBosnia and HerzegovinaBotswanaBrazilBrunei DarussalamBulgariaBurkina FasoBurundiCabo VerdeCambodiaCameroonCanadaCaribbean small statesCentral African RepublicCentral Europe and the BalticsChadChileChinaColombiaComorosCongo, Dem. Rep.Congo, Rep.Costa RicaCote d'IvoireCroatiaCubaCuracaoCyprusCzech RepublicDenmarkDjiboutiDominicaDominican RepublicEarly-demographic dividendEast Asia & PacificEast Asia & Pacific (excluding high income)East Asia & Pacific (IDA & IBRD countries)EcuadorEgypt, Arab Rep.El SalvadorEquatorial GuineaEritreaEstoniaEthiopiaEuro areaEurope & Central AsiaEurope & Central Asia (excluding high income)Europe & Central Asia (IDA & IBRD countries)European UnionFijiFinlandFragile and conflict affected situationsFranceGabonGambia, TheGeorgiaGermanyGhanaGreeceGrenadaGuatemalaGuineaGuinea-BissauGuyanaHaitiHeavily indebted poor countries (HIPC)High incomeHondurasHong Kong SAR, ChinaHungaryIBRD onlyIcelandIDA & IBRD totalIDA blendIDA onlyIDA totalIndiaIndonesiaIran, Islamic Rep.IraqIrelandIsraelItalyJamaicaJapanJordanKazakhstanKenyaKiribatiKorea, Dem. People’s Rep.Korea, Rep.KuwaitKyrgyz RepublicLao PDRLate-demographic dividendLatin America & Caribbean Latin America & Caribbean (excluding high income)Latin America & the Caribbean (IDA & IBRD countries)LatviaLeast developed countries: UN classificationLebanonLesothoLiberiaLibyaLiechtensteinLithuaniaLow & middle incomeLow incomeLower middle incomeLuxembourgMacao SAR, ChinaMacedonia, FYRMadagascarMalawiMaldivesMaliMaltaMarshall IslandsMauritaniaMauritiusMexicoMicronesia, Fed. Sts.Middle East & North AfricaMiddle East & North Africa (excluding high income)Middle East & North Africa (IDA & IBRD countries)Middle incomeMoldovaMongoliaMontenegroMoroccoMozambiqueMyanmarNamibiaNauruNepalNetherlandsNew ZealandNicaraguaNigerNigeriaNorth AmericaNorwayOECD membersOmanOther small statesPacific island small statesPakistanPalauPanamaPapua New GuineaParaguayPeruPhilippinesPolandPortugalPost-demographic dividendPre-demographic dividendPuerto RicoQatarRomaniaRussian FederationRwandaSamoaSan MarinoSao Tome and PrincipeSaudi ArabiaSenegalSerbiaSeychellesSierra LeoneSlovak RepublicSloveniaSmall statesSolomon IslandsSomaliaSouth AfricaSouth AsiaSouth Asia (IDA & IBRD)South SudanSpainSri LankaSt. Kitts and NevisSt. LuciaSt. Vincent and the GrenadinesSub-Saharan Africa Sub-Saharan Africa (excluding high income)Sub-Saharan Africa (IDA & IBRD countries)SudanSurinameSwazilandSwedenSwitzerlandSyrian Arab RepublicTajikistanTanzaniaThailandTimor-LesteTogoTongaTrinidad and TobagoTunisiaTurkeyTurkmenistanTuvaluUgandaUkraineUnited Arab EmiratesUnited KingdomUnited StatesUpper middle incomeUruguayUzbekistanVanuatuVenezuela, RBVietnamWest Bank and GazaWorldYemen, Rep.ZambiaZimbabwe Timeline:
This timeline shows a graph from 1971 to 2014 of Uruguay. No data until 1970. Number of actual observations by date: 41.
Source name:
World Development Indicators
Source organization:
United Nations Educational, Scientific, and Cultural Organization (UNESCO) Institute for Statistics.
Categories, topics:
Education, Gender
Last updated:
apr 23, 2017
Indicators value changes by year
Minimum:
105.205
jan 1, 1988
Maximum:
121.242
jan 1, 1982
At the date of observation
Value
Absolute change
Change from previous value
jan 1, 1971
109.17
+109.17
0.0%
jan 1, 1972
113.457
+4.287
3.93%
jan 1, 1973
111.31
-2.147
-1.89%
jan 1, 1974
113.639
+2.33
2.09%
jan 1, 1975
106.772
-6.868
-6.04%
jan 1, 1976
105.767
-1.005
-0.94%
jan 1, 1977
107.85
+2.084
1.97%
jan 1, 1978
108.948
+1.098
1.02%
jan 1, 1979
113.107
+4.159
3.82%
jan 1, 1980
106.801
-6.306
-5.58%
jan 1, 1981
106.511
-0.29
-0.27%
jan 1, 1982
121.242
+14.731
13.83%
jan 1, 1984
106.457
-14.785
-12.19%
jan 1, 1985
105.337
-1.121
-1.05%
jan 1, 1986
106.216
+0.879
0.83%
jan 1, 1987
105.36
-0.855
-0.81%
jan 1, 1988
105.205
-0.155
-0.15%
jan 1, 1989
105.449
+0.244
0.23%
jan 1, 1990
106.716
+1.267
1.2%
jan 1, 1991
107.892
+1.176
1.1%
jan 1, 1992
108.041
+0.149
0.14%
jan 1, 1993
108.138
+0.097
0.09%
jan 1, 1994
108.45
+0.312
0.29%
jan 1, 1995
107.574
-0.876
-0.81%
jan 1, 1996
107.257
-0.317
-0.29%
jan 1, 1997
107.454
+0.198
0.18%
jan 1, 1998
111.957
+4.503
4.19%
jan 1, 1999
111.143
-0.814
-0.73%
jan 1, 2000
110.484
-0.659
-0.59%
jan 1, 2001
108.083
-2.401
-2.17%
jan 1, 2002
107.139
-0.944
-0.87%
jan 1, 2003
108.909
+1.77
1.65%
jan 1, 2004
109.748
+0.84
0.77%
jan 1, 2005
111.072
+1.323
1.21%
jan 1, 2006
112.42
+1.348
1.21%
jan 1, 2007
113.634
+1.214
1.08%
jan 1, 2008
112.993
-0.641
-0.56%
jan 1, 2009
112.083
-0.91
-0.81%
jan 1, 2010
111.358
-0.725
-0.65%
jan 1, 2011
110.186
-1.171
-1.05%
jan 1, 2014
108.26
-1.926
-1.75%
Ranking of countries by current statistics by years


Comments: