30
/
AIzaSyAYiBZKx7MnpbEhh9jyipgxe19OcubqV5w
April 1, 2024
232773
Samoa
WSM
true
2
1
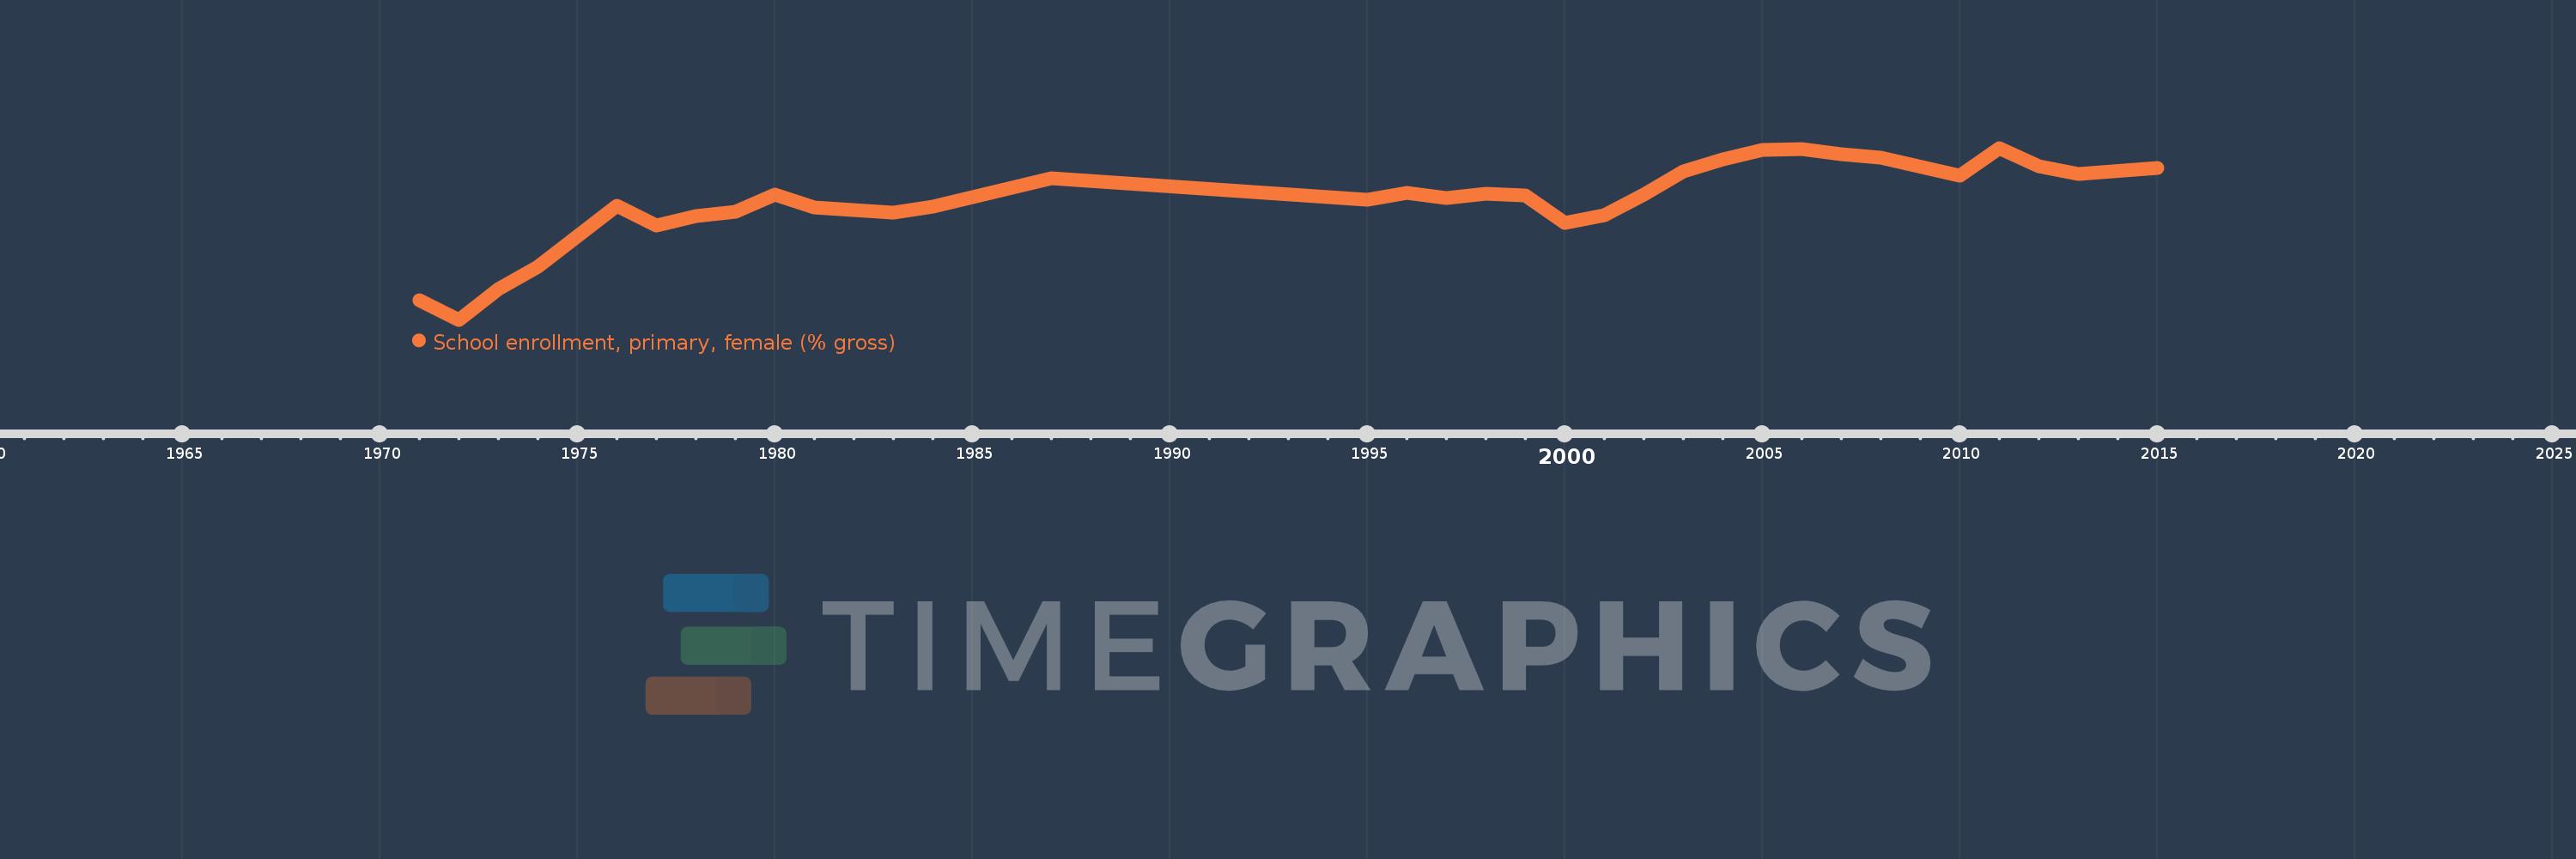
School enrollment, primary, female (% gross)
2015,2013,2012,2011,2010,2008,2007,2006,2005,2004,2003,2002,2001,2000,1999,1998,1997,1996,1995,1987,1984,1983,1982,1981,1980,1979,1978,1977,1976,1974,1973,1972,1971
