29
/
en
AIzaSyAYiBZKx7MnpbEhh9jyipgxe19OcubqV5w
April 1, 2024
276140
United Kingdom
GBR
true
2
1
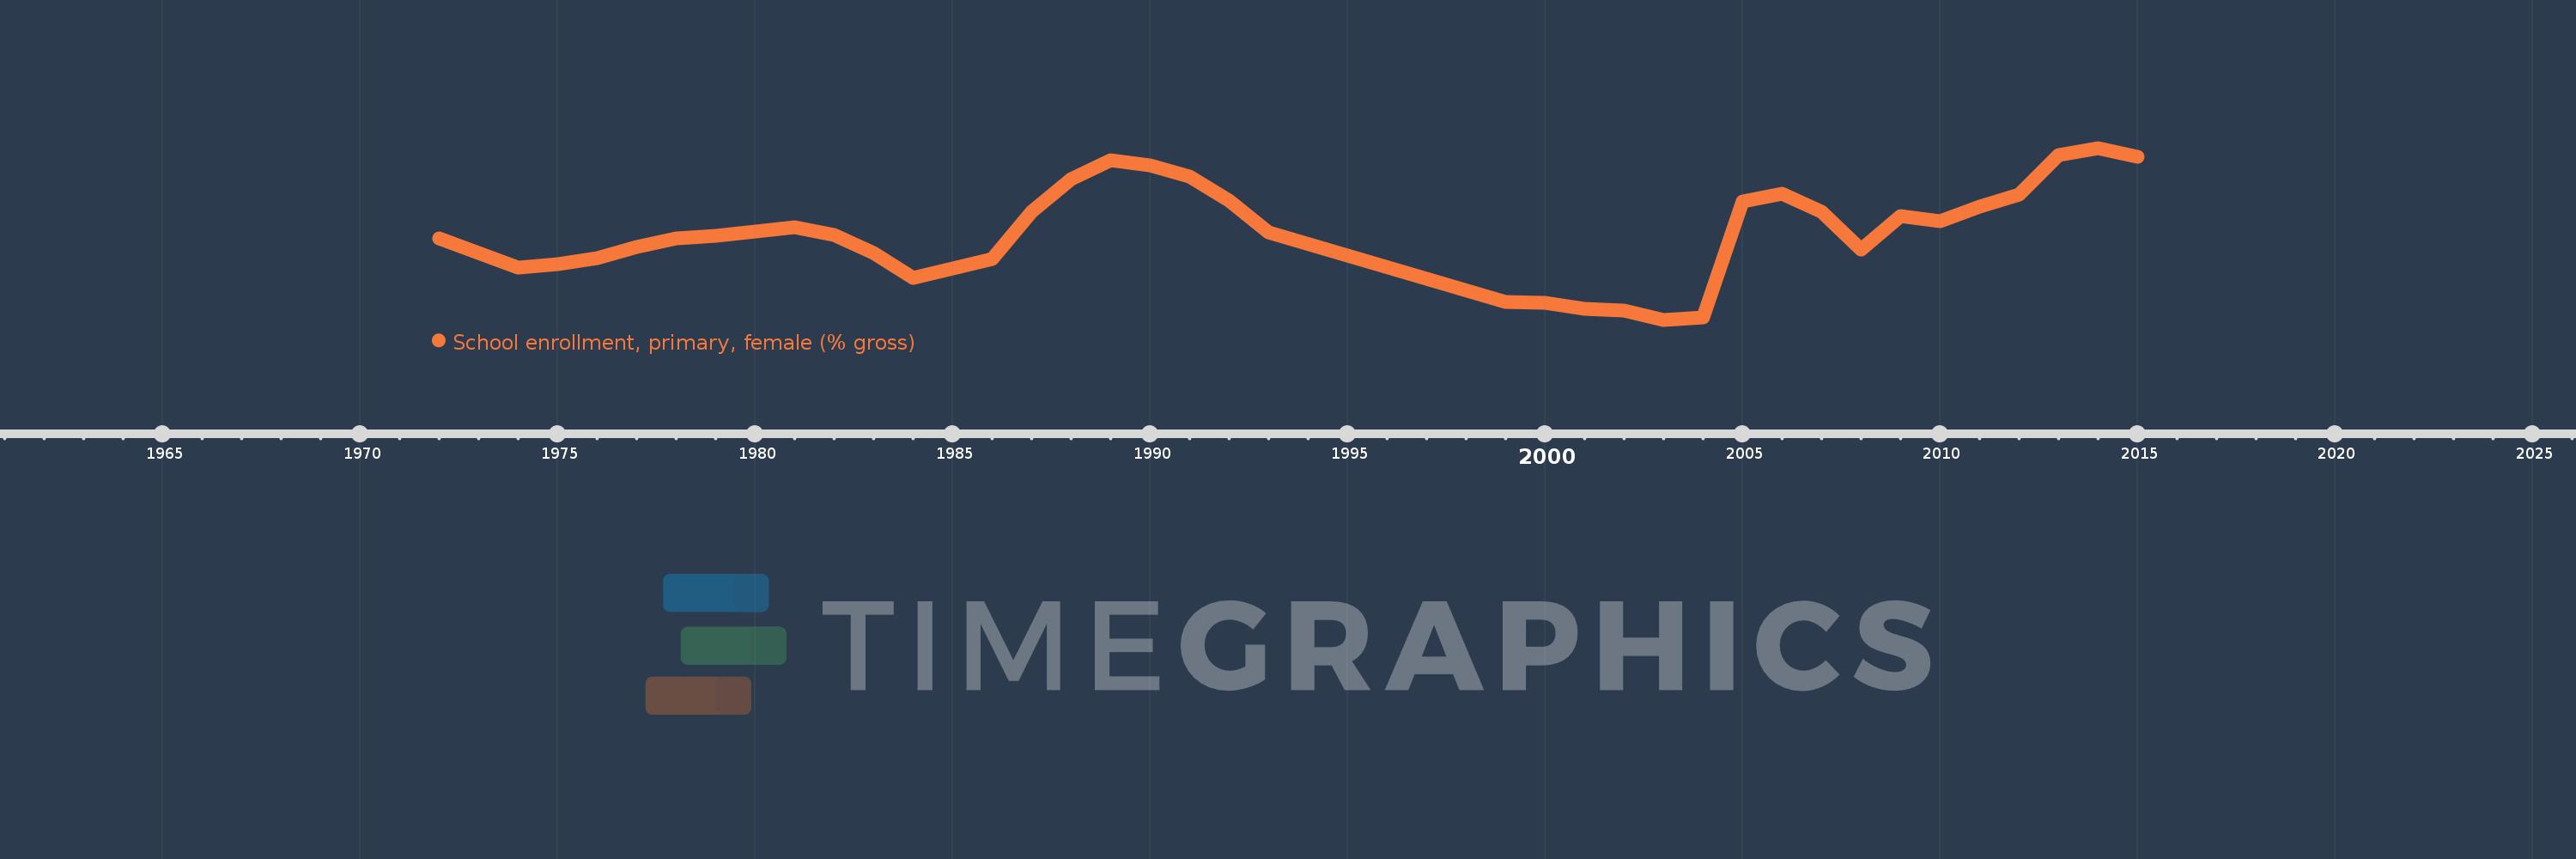
School enrollment, primary, female (% gross)
2015,2014,2013,2012,2011,2010,2009,2008,2007,2006,2005,2004,2003,2002,2001,2000,1999,1993,1992,1991,1990,1989,1988,1987,1986,1985,1984,1983,1982,1981,1980,1979,1978,1977,1976,1975,1974,1973,1972
This statistics in other country:
AfghanistanAlbaniaAlgeriaAndorraAngolaAntigua and BarbudaArab WorldArgentinaArmeniaArubaAustraliaAustriaAzerbaijanBahamas, TheBahrainBangladeshBarbadosBelarusBelgiumBelizeBeninBermudaBhutanBoliviaBosnia and HerzegovinaBotswanaBrazilBrunei DarussalamBulgariaBurkina FasoBurundiCabo VerdeCambodiaCameroonCanadaCaribbean small statesCentral African RepublicCentral Europe and the BalticsChadChileChinaColombiaComorosCongo, Dem. Rep.Congo, Rep.Costa RicaCote d'IvoireCroatiaCubaCuracaoCyprusCzech RepublicDenmarkDjiboutiDominicaDominican RepublicEarly-demographic dividendEast Asia & PacificEast Asia & Pacific (excluding high income)East Asia & Pacific (IDA & IBRD countries)EcuadorEgypt, Arab Rep.El SalvadorEquatorial GuineaEritreaEstoniaEthiopiaEuro areaEurope & Central AsiaEurope & Central Asia (excluding high income)Europe & Central Asia (IDA & IBRD countries)European UnionFijiFinlandFragile and conflict affected situationsFranceGabonGambia, TheGeorgiaGermanyGhanaGreeceGrenadaGuatemalaGuineaGuinea-BissauGuyanaHaitiHeavily indebted poor countries (HIPC)High incomeHondurasHong Kong SAR, ChinaHungaryIBRD onlyIcelandIDA & IBRD totalIDA blendIDA onlyIDA totalIndiaIndonesiaIran, Islamic Rep.IraqIrelandIsraelItalyJamaicaJapanJordanKazakhstanKenyaKiribatiKorea, Dem. People’s Rep.Korea, Rep.KuwaitKyrgyz RepublicLao PDRLate-demographic dividendLatin America & Caribbean Latin America & Caribbean (excluding high income)Latin America & the Caribbean (IDA & IBRD countries)LatviaLeast developed countries: UN classificationLebanonLesothoLiberiaLibyaLiechtensteinLithuaniaLow & middle incomeLow incomeLower middle incomeLuxembourgMacao SAR, ChinaMacedonia, FYRMadagascarMalawiMaldivesMaliMaltaMarshall IslandsMauritaniaMauritiusMexicoMicronesia, Fed. Sts.Middle East & North AfricaMiddle East & North Africa (excluding high income)Middle East & North Africa (IDA & IBRD countries)Middle incomeMoldovaMongoliaMontenegroMoroccoMozambiqueMyanmarNamibiaNauruNepalNetherlandsNew ZealandNicaraguaNigerNigeriaNorth AmericaNorwayOECD membersOmanOther small statesPacific island small statesPakistanPalauPanamaPapua New GuineaParaguayPeruPhilippinesPolandPortugalPost-demographic dividendPre-demographic dividendPuerto RicoQatarRomaniaRussian FederationRwandaSamoaSan MarinoSao Tome and PrincipeSaudi ArabiaSenegalSerbiaSeychellesSierra LeoneSlovak RepublicSloveniaSmall statesSolomon IslandsSomaliaSouth AfricaSouth AsiaSouth Asia (IDA & IBRD)South SudanSpainSri LankaSt. Kitts and NevisSt. LuciaSt. Vincent and the GrenadinesSub-Saharan Africa Sub-Saharan Africa (excluding high income)Sub-Saharan Africa (IDA & IBRD countries)SudanSurinameSwazilandSwedenSwitzerlandSyrian Arab RepublicTajikistanTanzaniaThailandTimor-LesteTogoTongaTrinidad and TobagoTunisiaTurkeyTurkmenistanTuvaluUgandaUkraineUnited Arab EmiratesUnited KingdomUnited StatesUpper middle incomeUruguayUzbekistanVanuatuVenezuela, RBVietnamWest Bank and GazaWorldYemen, Rep.ZambiaZimbabwe Timeline:
This timeline shows a graph from 1972 to 2015 of United Kingdom. No data until 1971. Number of actual observations by date: 39.
Source name:
World Development Indicators
Source organization:
United Nations Educational, Scientific, and Cultural Organization (UNESCO) Institute for Statistics.
Categories, topics:
Education, Gender
Last updated:
apr 23, 2017
Indicators value changes by year
Maximum:
108.547
jan 1, 2014
At the date of observation
Value
Absolute change
Change from previous value
jan 1, 1972
103.967
+103.967
0.0%
jan 1, 1973
103.216
-0.751
-0.72%
jan 1, 1974
102.494
-0.722
-0.7%
jan 1, 1975
102.642
+0.148
0.14%
jan 1, 1976
102.959
+0.317
0.31%
jan 1, 1977
103.54
+0.581
0.56%
jan 1, 1978
103.962
+0.421
0.41%
jan 1, 1979
104.097
+0.136
0.13%
jan 1, 1980
104.308
+0.211
0.2%
jan 1, 1981
104.513
+0.205
0.2%
jan 1, 1982
104.141
-0.372
-0.36%
jan 1, 1983
103.223
-0.918
-0.88%
jan 1, 1984
101.953
-1.27
-1.23%
jan 1, 1985
102.433
+0.48
0.47%
jan 1, 1986
102.935
+0.502
0.49%
jan 1, 1987
105.298
+2.363
2.3%
jan 1, 1988
106.956
+1.658
1.57%
jan 1, 1989
107.914
+0.958
0.9%
jan 1, 1990
107.669
-0.244
-0.23%
jan 1, 1991
107.085
-0.584
-0.54%
jan 1, 1992
105.861
-1.224
-1.14%
jan 1, 1993
104.264
-1.597
-1.51%
jan 1, 1999
100.743
-3.521
-3.38%
jan 1, 2000
100.722
-0.021
-0.02%
jan 1, 2001
100.417
-0.305
-0.3%
jan 1, 2002
100.295
-0.122
-0.12%
jan 1, 2003
99.85
-0.445
-0.44%
jan 1, 2004
99.986
+0.136
0.14%
jan 1, 2005
105.831
+5.845
5.85%
jan 1, 2006
106.21
+0.379
0.36%
jan 1, 2007
105.299
-0.912
-0.86%
jan 1, 2008
103.381
-1.917
-1.82%
jan 1, 2009
105.103
+1.722
1.67%
jan 1, 2010
104.844
-0.259
-0.25%
jan 1, 2011
105.591
+0.747
0.71%
jan 1, 2012
106.165
+0.574
0.54%
jan 1, 2013
108.167
+2.002
1.89%
jan 1, 2014
108.547
+0.38
0.35%
jan 1, 2015
108.079
-0.467
-0.43%
Ranking of countries by current statistics by years


Comments: