29
/
en
AIzaSyAYiBZKx7MnpbEhh9jyipgxe19OcubqV5w
April 1, 2024
52225
North America
NAC
false
2
1
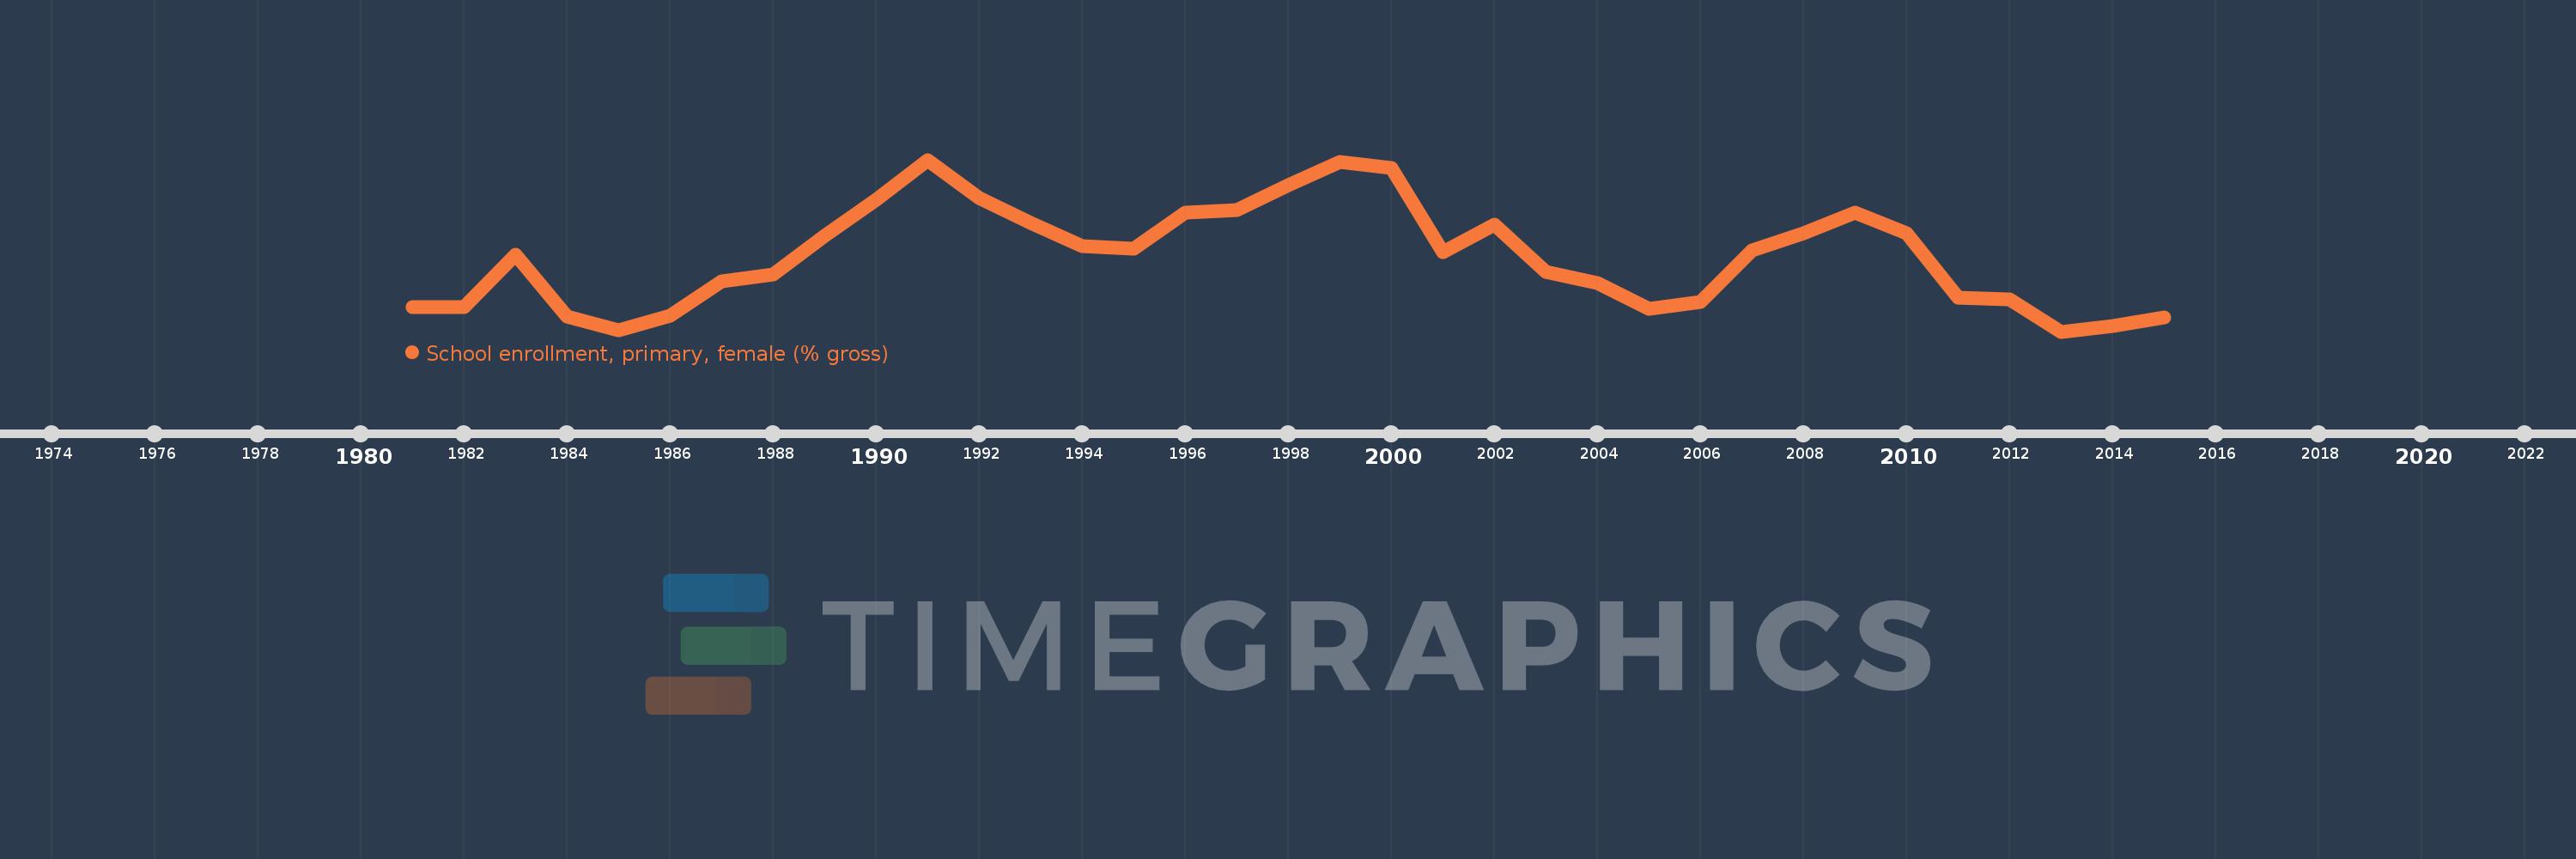
School enrollment, primary, female (% gross)
2015,2014,2013,2012,2011,2010,2009,2008,2007,2006,2005,2004,2003,2002,2001,2000,1999,1998,1997,1996,1995,1994,1993,1992,1991,1990,1989,1988,1987,1986,1985,1984,1983,1982,1981
This statistics in other country:
AfghanistanAlbaniaAlgeriaAndorraAngolaAntigua and BarbudaArab WorldArgentinaArmeniaArubaAustraliaAustriaAzerbaijanBahamas, TheBahrainBangladeshBarbadosBelarusBelgiumBelizeBeninBermudaBhutanBoliviaBosnia and HerzegovinaBotswanaBrazilBrunei DarussalamBulgariaBurkina FasoBurundiCabo VerdeCambodiaCameroonCanadaCaribbean small statesCentral African RepublicCentral Europe and the BalticsChadChileChinaColombiaComorosCongo, Dem. Rep.Congo, Rep.Costa RicaCote d'IvoireCroatiaCubaCuracaoCyprusCzech RepublicDenmarkDjiboutiDominicaDominican RepublicEarly-demographic dividendEast Asia & PacificEast Asia & Pacific (excluding high income)East Asia & Pacific (IDA & IBRD countries)EcuadorEgypt, Arab Rep.El SalvadorEquatorial GuineaEritreaEstoniaEthiopiaEuro areaEurope & Central AsiaEurope & Central Asia (excluding high income)Europe & Central Asia (IDA & IBRD countries)European UnionFijiFinlandFragile and conflict affected situationsFranceGabonGambia, TheGeorgiaGermanyGhanaGreeceGrenadaGuatemalaGuineaGuinea-BissauGuyanaHaitiHeavily indebted poor countries (HIPC)High incomeHondurasHong Kong SAR, ChinaHungaryIBRD onlyIcelandIDA & IBRD totalIDA blendIDA onlyIDA totalIndiaIndonesiaIran, Islamic Rep.IraqIrelandIsraelItalyJamaicaJapanJordanKazakhstanKenyaKiribatiKorea, Dem. People’s Rep.Korea, Rep.KuwaitKyrgyz RepublicLao PDRLate-demographic dividendLatin America & Caribbean Latin America & Caribbean (excluding high income)Latin America & the Caribbean (IDA & IBRD countries)LatviaLeast developed countries: UN classificationLebanonLesothoLiberiaLibyaLiechtensteinLithuaniaLow & middle incomeLow incomeLower middle incomeLuxembourgMacao SAR, ChinaMacedonia, FYRMadagascarMalawiMaldivesMaliMaltaMarshall IslandsMauritaniaMauritiusMexicoMicronesia, Fed. Sts.Middle East & North AfricaMiddle East & North Africa (excluding high income)Middle East & North Africa (IDA & IBRD countries)Middle incomeMoldovaMongoliaMontenegroMoroccoMozambiqueMyanmarNamibiaNauruNepalNetherlandsNew ZealandNicaraguaNigerNigeriaNorth AmericaNorwayOECD membersOmanOther small statesPacific island small statesPakistanPalauPanamaPapua New GuineaParaguayPeruPhilippinesPolandPortugalPost-demographic dividendPre-demographic dividendPuerto RicoQatarRomaniaRussian FederationRwandaSamoaSan MarinoSao Tome and PrincipeSaudi ArabiaSenegalSerbiaSeychellesSierra LeoneSlovak RepublicSloveniaSmall statesSolomon IslandsSomaliaSouth AfricaSouth AsiaSouth Asia (IDA & IBRD)South SudanSpainSri LankaSt. Kitts and NevisSt. LuciaSt. Vincent and the GrenadinesSub-Saharan Africa Sub-Saharan Africa (excluding high income)Sub-Saharan Africa (IDA & IBRD countries)SudanSurinameSwazilandSwedenSwitzerlandSyrian Arab RepublicTajikistanTanzaniaThailandTimor-LesteTogoTongaTrinidad and TobagoTunisiaTurkeyTurkmenistanTuvaluUgandaUkraineUnited Arab EmiratesUnited KingdomUnited StatesUpper middle incomeUruguayUzbekistanVanuatuVenezuela, RBVietnamWest Bank and GazaWorldYemen, Rep.ZambiaZimbabwe Timeline:
This timeline shows a graph from 1981 to 2015 of North America. No data until 1980. Number of actual observations by date: 35.
Source name:
World Development Indicators
Source organization:
United Nations Educational, Scientific, and Cultural Organization (UNESCO) Institute for Statistics.
Categories, topics:
Education, Gender
Last updated:
apr 23, 2017
Indicators value changes by year
Minimum:
98.878
jan 1, 2013
Maximum:
104.989
jan 1, 1991
At the date of observation
Value
Absolute change
Change from previous value
jan 1, 1981
99.749
+99.749
0.0%
jan 1, 1982
99.748
-0.001
0.0%
jan 1, 1983
101.606
+1.859
1.86%
jan 1, 1984
99.42
-2.187
-2.15%
jan 1, 1985
98.939
-0.481
-0.48%
jan 1, 1986
99.447
+0.509
0.51%
jan 1, 1987
100.678
+1.231
1.24%
jan 1, 1988
100.896
+0.218
0.22%
jan 1, 1989
102.276
+1.379
1.37%
jan 1, 1990
103.564
+1.289
1.26%
jan 1, 1991
104.989
+1.425
1.38%
jan 1, 1992
103.619
-1.371
-1.31%
jan 1, 1993
102.755
-0.864
-0.83%
jan 1, 1994
101.921
-0.833
-0.81%
jan 1, 1995
101.834
-0.087
-0.09%
jan 1, 1996
103.113
+1.279
1.26%
jan 1, 1997
103.188
+0.074
0.07%
jan 1, 1998
104.075
+0.888
0.86%
jan 1, 1999
104.912
+0.836
0.8%
jan 1, 2000
104.697
-0.215
-0.21%
jan 1, 2001
101.691
-3.005
-2.87%
jan 1, 2002
102.696
+1.004
0.99%
jan 1, 2003
100.991
-1.705
-1.66%
jan 1, 2004
100.618
-0.373
-0.37%
jan 1, 2005
99.701
-0.917
-0.91%
jan 1, 2006
99.933
+0.232
0.23%
jan 1, 2007
101.76
+1.827
1.83%
jan 1, 2008
102.382
+0.622
0.61%
jan 1, 2009
103.125
+0.743
0.73%
jan 1, 2010
102.371
-0.754
-0.73%
jan 1, 2011
100.07
-2.301
-2.25%
jan 1, 2012
100.031
-0.039
-0.04%
jan 1, 2013
98.878
-1.153
-1.15%
jan 1, 2014
99.09
+0.212
0.21%
jan 1, 2015
99.373
+0.283
0.29%
Ranking of countries by current statistics by years


Comments: