29
/
en
AIzaSyAYiBZKx7MnpbEhh9jyipgxe19OcubqV5w
April 1, 2024
50441
Middle East & North Africa (IDA & IBRD countries)
TMN
false
2
1
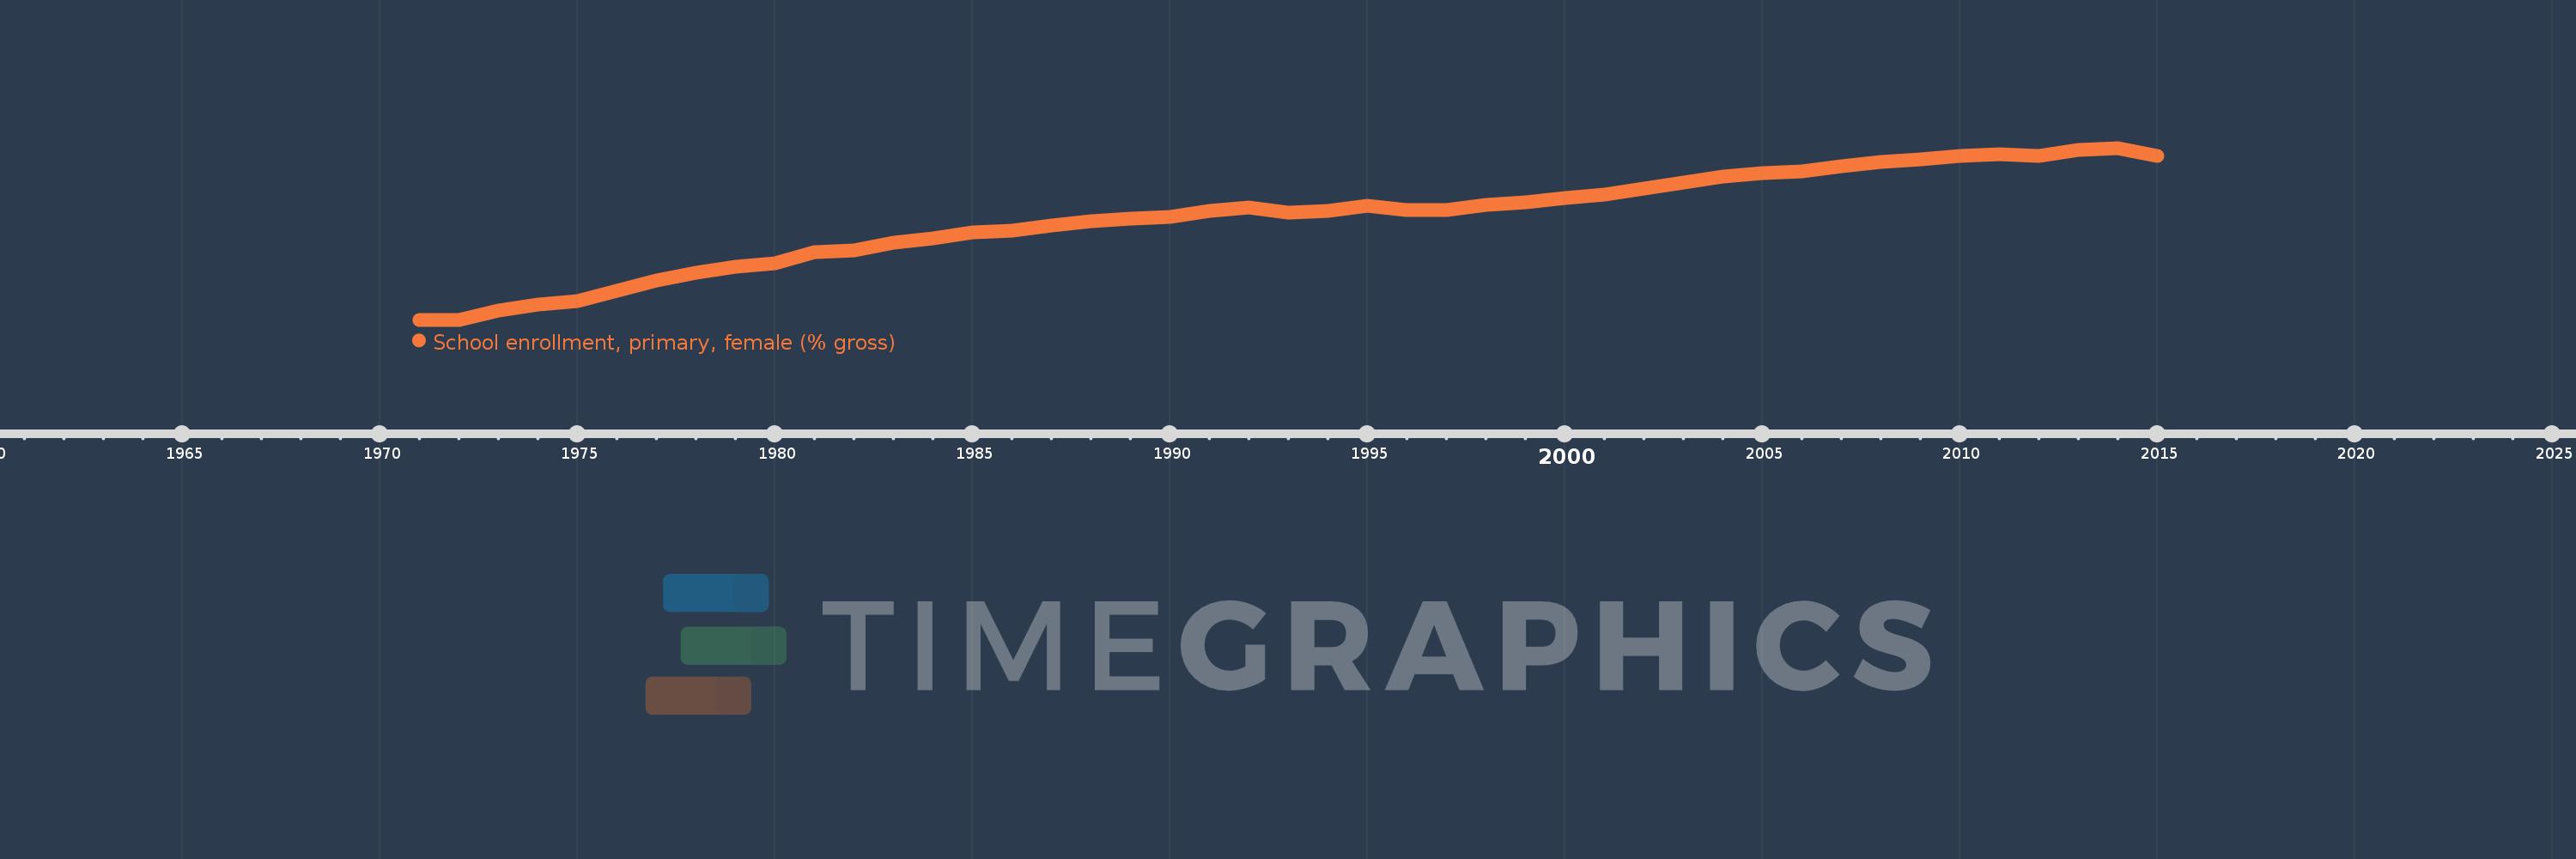
School enrollment, primary, female (% gross)
2015,2014,2013,2012,2011,2010,2009,2008,2007,2006,2005,2004,2003,2002,2001,2000,1999,1998,1997,1996,1995,1994,1993,1992,1991,1990,1989,1988,1987,1986,1985,1984,1983,1982,1981,1980,1979,1978,1977,1976,1975,1974,1973,1972,1971
This statistics in other country:
AfghanistanAlbaniaAlgeriaAndorraAngolaAntigua and BarbudaArab WorldArgentinaArmeniaArubaAustraliaAustriaAzerbaijanBahamas, TheBahrainBangladeshBarbadosBelarusBelgiumBelizeBeninBermudaBhutanBoliviaBosnia and HerzegovinaBotswanaBrazilBrunei DarussalamBulgariaBurkina FasoBurundiCabo VerdeCambodiaCameroonCanadaCaribbean small statesCentral African RepublicCentral Europe and the BalticsChadChileChinaColombiaComorosCongo, Dem. Rep.Congo, Rep.Costa RicaCote d'IvoireCroatiaCubaCuracaoCyprusCzech RepublicDenmarkDjiboutiDominicaDominican RepublicEarly-demographic dividendEast Asia & PacificEast Asia & Pacific (excluding high income)East Asia & Pacific (IDA & IBRD countries)EcuadorEgypt, Arab Rep.El SalvadorEquatorial GuineaEritreaEstoniaEthiopiaEuro areaEurope & Central AsiaEurope & Central Asia (excluding high income)Europe & Central Asia (IDA & IBRD countries)European UnionFijiFinlandFragile and conflict affected situationsFranceGabonGambia, TheGeorgiaGermanyGhanaGreeceGrenadaGuatemalaGuineaGuinea-BissauGuyanaHaitiHeavily indebted poor countries (HIPC)High incomeHondurasHong Kong SAR, ChinaHungaryIBRD onlyIcelandIDA & IBRD totalIDA blendIDA onlyIDA totalIndiaIndonesiaIran, Islamic Rep.IraqIrelandIsraelItalyJamaicaJapanJordanKazakhstanKenyaKiribatiKorea, Dem. People’s Rep.Korea, Rep.KuwaitKyrgyz RepublicLao PDRLate-demographic dividendLatin America & Caribbean Latin America & Caribbean (excluding high income)Latin America & the Caribbean (IDA & IBRD countries)LatviaLeast developed countries: UN classificationLebanonLesothoLiberiaLibyaLiechtensteinLithuaniaLow & middle incomeLow incomeLower middle incomeLuxembourgMacao SAR, ChinaMacedonia, FYRMadagascarMalawiMaldivesMaliMaltaMarshall IslandsMauritaniaMauritiusMexicoMicronesia, Fed. Sts.Middle East & North AfricaMiddle East & North Africa (excluding high income)Middle East & North Africa (IDA & IBRD countries)Middle incomeMoldovaMongoliaMontenegroMoroccoMozambiqueMyanmarNamibiaNauruNepalNetherlandsNew ZealandNicaraguaNigerNigeriaNorth AmericaNorwayOECD membersOmanOther small statesPacific island small statesPakistanPalauPanamaPapua New GuineaParaguayPeruPhilippinesPolandPortugalPost-demographic dividendPre-demographic dividendPuerto RicoQatarRomaniaRussian FederationRwandaSamoaSan MarinoSao Tome and PrincipeSaudi ArabiaSenegalSerbiaSeychellesSierra LeoneSlovak RepublicSloveniaSmall statesSolomon IslandsSomaliaSouth AfricaSouth AsiaSouth Asia (IDA & IBRD)South SudanSpainSri LankaSt. Kitts and NevisSt. LuciaSt. Vincent and the GrenadinesSub-Saharan Africa Sub-Saharan Africa (excluding high income)Sub-Saharan Africa (IDA & IBRD countries)SudanSurinameSwazilandSwedenSwitzerlandSyrian Arab RepublicTajikistanTanzaniaThailandTimor-LesteTogoTongaTrinidad and TobagoTunisiaTurkeyTurkmenistanTuvaluUgandaUkraineUnited Arab EmiratesUnited KingdomUnited StatesUpper middle incomeUruguayUzbekistanVanuatuVenezuela, RBVietnamWest Bank and GazaWorldYemen, Rep.ZambiaZimbabwe Timeline:
This timeline shows a graph from 1971 to 2015 of Middle East & North Africa (IDA & IBRD countries). No data until 1970. Number of actual observations by date: 45.
Source name:
World Development Indicators
Source organization:
United Nations Educational, Scientific, and Cultural Organization (UNESCO) Institute for Statistics.
Categories, topics:
Education, Gender
Last updated:
apr 23, 2017
Indicators value changes by year
Minimum:
54.062
jan 1, 1972
Maximum:
104.876
jan 1, 2014
At the date of observation
Value
Absolute change
Change from previous value
jan 1, 1971
54.098
+54.098
0.0%
jan 1, 1972
54.062
-0.036
-0.07%
jan 1, 1973
56.708
+2.645
4.89%
jan 1, 1974
58.621
+1.913
3.37%
jan 1, 1975
59.605
+0.984
1.68%
jan 1, 1976
62.707
+3.101
5.2%
jan 1, 1977
65.795
+3.089
4.93%
jan 1, 1978
68.083
+2.288
3.48%
jan 1, 1979
69.831
+1.747
2.57%
jan 1, 1980
70.736
+0.905
1.3%
jan 1, 1981
74.129
+3.394
4.8%
jan 1, 1982
74.49
+0.36
0.49%
jan 1, 1983
76.77
+2.28
3.06%
jan 1, 1984
78.215
+1.445
1.88%
jan 1, 1985
79.958
+1.743
2.23%
jan 1, 1986
80.407
+0.448
0.56%
jan 1, 1987
81.838
+1.432
1.78%
jan 1, 1988
83.203
+1.365
1.67%
jan 1, 1989
83.91
+0.707
0.85%
jan 1, 1990
84.537
+0.628
0.75%
jan 1, 1991
86.361
+1.824
2.16%
jan 1, 1992
87.387
+1.026
1.19%
jan 1, 1993
85.736
-1.652
-1.89%
jan 1, 1994
86.129
+0.393
0.46%
jan 1, 1995
87.78
+1.651
1.92%
jan 1, 1996
86.448
-1.332
-1.52%
jan 1, 1997
86.539
+0.091
0.11%
jan 1, 1998
87.932
+1.393
1.61%
jan 1, 1999
88.888
+0.956
1.09%
jan 1, 2000
89.999
+1.111
1.25%
jan 1, 2001
91.183
+1.183
1.31%
jan 1, 2002
92.931
+1.749
1.92%
jan 1, 2003
94.744
+1.813
1.95%
jan 1, 2004
96.371
+1.627
1.72%
jan 1, 2005
97.394
+1.023
1.06%
jan 1, 2006
97.822
+0.427
0.44%
jan 1, 2007
99.355
+1.533
1.57%
jan 1, 2008
100.791
+1.436
1.45%
jan 1, 2009
101.614
+0.823
0.82%
jan 1, 2010
102.564
+0.95
0.93%
jan 1, 2011
103.145
+0.582
0.57%
jan 1, 2012
102.437
-0.708
-0.69%
jan 1, 2013
104.412
+1.974
1.93%
jan 1, 2014
104.876
+0.464
0.44%
jan 1, 2015
102.584
-2.292
-2.19%
Ranking of countries by current statistics by years


Comments: