29
/
en
AIzaSyAYiBZKx7MnpbEhh9jyipgxe19OcubqV5w
April 1, 2024
193657
Mauritania
MRT
true
2
1
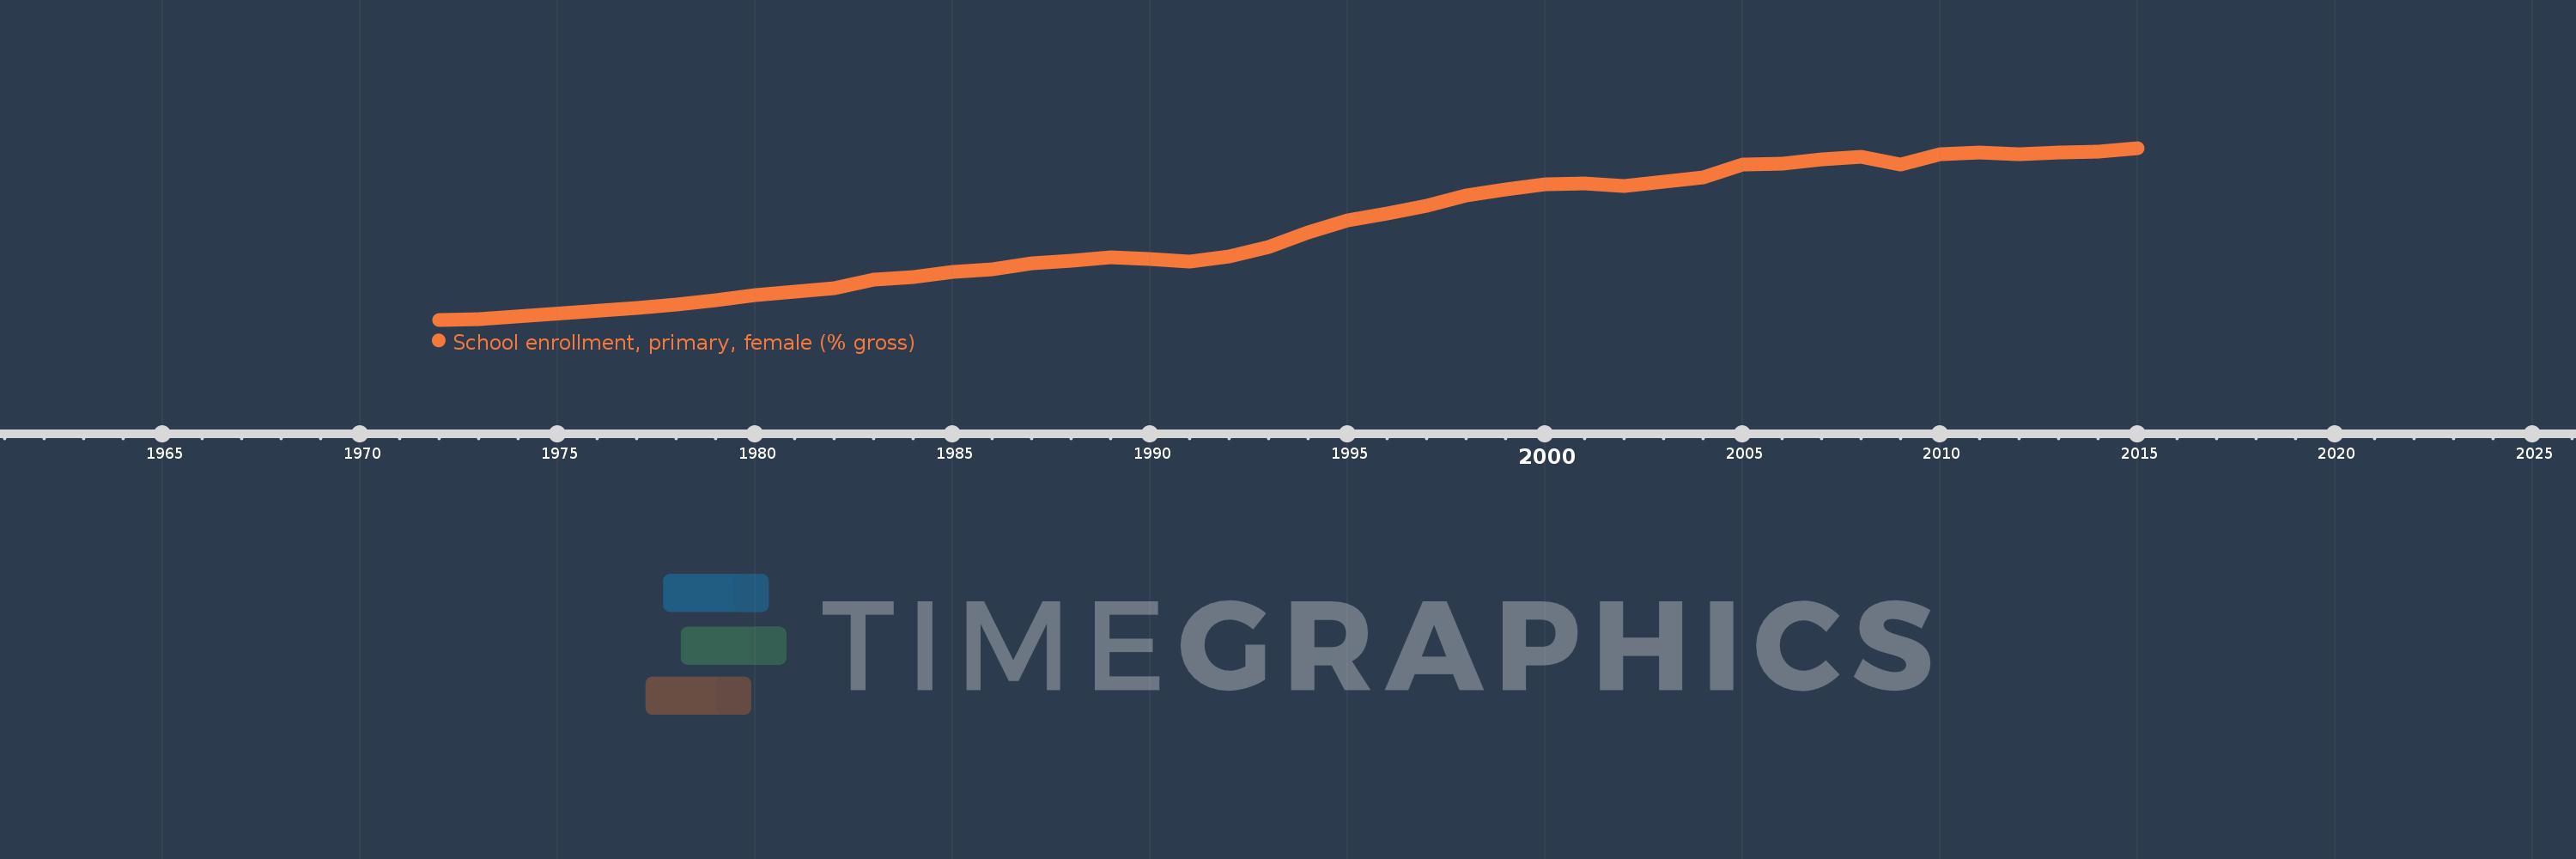
School enrollment, primary, female (% gross)
2015,2014,2013,2012,2011,2010,2009,2008,2007,2006,2005,2004,2003,2002,2001,2000,1999,1998,1997,1996,1995,1994,1993,1992,1991,1990,1989,1988,1987,1986,1985,1984,1983,1982,1980,1979,1978,1977,1973,1972
This statistics in other country:
AfghanistanAlbaniaAlgeriaAndorraAngolaAntigua and BarbudaArab WorldArgentinaArmeniaArubaAustraliaAustriaAzerbaijanBahamas, TheBahrainBangladeshBarbadosBelarusBelgiumBelizeBeninBermudaBhutanBoliviaBosnia and HerzegovinaBotswanaBrazilBrunei DarussalamBulgariaBurkina FasoBurundiCabo VerdeCambodiaCameroonCanadaCaribbean small statesCentral African RepublicCentral Europe and the BalticsChadChileChinaColombiaComorosCongo, Dem. Rep.Congo, Rep.Costa RicaCote d'IvoireCroatiaCubaCuracaoCyprusCzech RepublicDenmarkDjiboutiDominicaDominican RepublicEarly-demographic dividendEast Asia & PacificEast Asia & Pacific (excluding high income)East Asia & Pacific (IDA & IBRD countries)EcuadorEgypt, Arab Rep.El SalvadorEquatorial GuineaEritreaEstoniaEthiopiaEuro areaEurope & Central AsiaEurope & Central Asia (excluding high income)Europe & Central Asia (IDA & IBRD countries)European UnionFijiFinlandFragile and conflict affected situationsFranceGabonGambia, TheGeorgiaGermanyGhanaGreeceGrenadaGuatemalaGuineaGuinea-BissauGuyanaHaitiHeavily indebted poor countries (HIPC)High incomeHondurasHong Kong SAR, ChinaHungaryIBRD onlyIcelandIDA & IBRD totalIDA blendIDA onlyIDA totalIndiaIndonesiaIran, Islamic Rep.IraqIrelandIsraelItalyJamaicaJapanJordanKazakhstanKenyaKiribatiKorea, Dem. People’s Rep.Korea, Rep.KuwaitKyrgyz RepublicLao PDRLate-demographic dividendLatin America & Caribbean Latin America & Caribbean (excluding high income)Latin America & the Caribbean (IDA & IBRD countries)LatviaLeast developed countries: UN classificationLebanonLesothoLiberiaLibyaLiechtensteinLithuaniaLow & middle incomeLow incomeLower middle incomeLuxembourgMacao SAR, ChinaMacedonia, FYRMadagascarMalawiMaldivesMaliMaltaMarshall IslandsMauritaniaMauritiusMexicoMicronesia, Fed. Sts.Middle East & North AfricaMiddle East & North Africa (excluding high income)Middle East & North Africa (IDA & IBRD countries)Middle incomeMoldovaMongoliaMontenegroMoroccoMozambiqueMyanmarNamibiaNauruNepalNetherlandsNew ZealandNicaraguaNigerNigeriaNorth AmericaNorwayOECD membersOmanOther small statesPacific island small statesPakistanPalauPanamaPapua New GuineaParaguayPeruPhilippinesPolandPortugalPost-demographic dividendPre-demographic dividendPuerto RicoQatarRomaniaRussian FederationRwandaSamoaSan MarinoSao Tome and PrincipeSaudi ArabiaSenegalSerbiaSeychellesSierra LeoneSlovak RepublicSloveniaSmall statesSolomon IslandsSomaliaSouth AfricaSouth AsiaSouth Asia (IDA & IBRD)South SudanSpainSri LankaSt. Kitts and NevisSt. LuciaSt. Vincent and the GrenadinesSub-Saharan Africa Sub-Saharan Africa (excluding high income)Sub-Saharan Africa (IDA & IBRD countries)SudanSurinameSwazilandSwedenSwitzerlandSyrian Arab RepublicTajikistanTanzaniaThailandTimor-LesteTogoTongaTrinidad and TobagoTunisiaTurkeyTurkmenistanTuvaluUgandaUkraineUnited Arab EmiratesUnited KingdomUnited StatesUpper middle incomeUruguayUzbekistanVanuatuVenezuela, RBVietnamWest Bank and GazaWorldYemen, Rep.ZambiaZimbabwe Timeline:
This timeline shows a graph from 1972 to 2015 of Mauritania. No data until 1971. Number of actual observations by date: 40.
Source name:
World Development Indicators
Source organization:
United Nations Educational, Scientific, and Cultural Organization (UNESCO) Institute for Statistics.
Categories, topics:
Education, Gender
Last updated:
apr 23, 2017
Indicators value changes by year
Maximum:
100.672
jan 1, 2015
At the date of observation
Value
Absolute change
Change from previous value
jan 1, 1972
8.037
+8.037
0.0%
jan 1, 1973
8.554
+0.517
6.44%
jan 1, 1977
14.168
+5.614
65.63%
jan 1, 1978
16.133
+1.964
13.87%
jan 1, 1979
18.451
+2.318
14.37%
jan 1, 1980
21.171
+2.72
14.74%
jan 1, 1982
25.022
+3.851
18.19%
jan 1, 1983
29.722
+4.701
18.79%
jan 1, 1984
30.953
+1.23
4.14%
jan 1, 1985
33.978
+3.025
9.77%
jan 1, 1986
35.326
+1.348
3.97%
jan 1, 1987
38.307
+2.981
8.44%
jan 1, 1988
39.677
+1.37
3.58%
jan 1, 1989
41.538
+1.862
4.69%
jan 1, 1990
40.822
-0.716
-1.72%
jan 1, 1991
39.432
-1.39
-3.41%
jan 1, 1992
42.203
+2.771
7.03%
jan 1, 1993
47.374
+5.171
12.25%
jan 1, 1994
55.255
+7.881
16.64%
jan 1, 1995
61.401
+6.145
11.12%
jan 1, 1996
65.133
+3.732
6.08%
jan 1, 1997
69.573
+4.44
6.82%
jan 1, 1998
74.964
+5.391
7.75%
jan 1, 1999
78.418
+3.454
4.61%
jan 1, 2000
81.199
+2.78
3.55%
jan 1, 2001
81.387
+0.188
0.23%
jan 1, 2002
80.179
-1.208
-1.48%
jan 1, 2003
82.4
+2.221
2.77%
jan 1, 2004
84.933
+2.533
3.07%
jan 1, 2005
91.542
+6.609
7.78%
jan 1, 2006
92.229
+0.687
0.75%
jan 1, 2007
94.29
+2.06
2.23%
jan 1, 2008
95.67
+1.381
1.46%
jan 1, 2009
91.879
-3.791
-3.96%
jan 1, 2010
97.328
+5.449
5.93%
jan 1, 2011
98.384
+1.057
1.09%
jan 1, 2012
97.502
-0.882
-0.9%
jan 1, 2013
98.284
+0.782
0.8%
jan 1, 2014
98.572
+0.288
0.29%
jan 1, 2015
100.672
+2.1
2.13%
Ranking of countries by current statistics by years


Comments: