29
/
en
AIzaSyAYiBZKx7MnpbEhh9jyipgxe19OcubqV5w
April 1, 2024
28681
East Asia & Pacific (excluding high income)
EAP
false
2
1
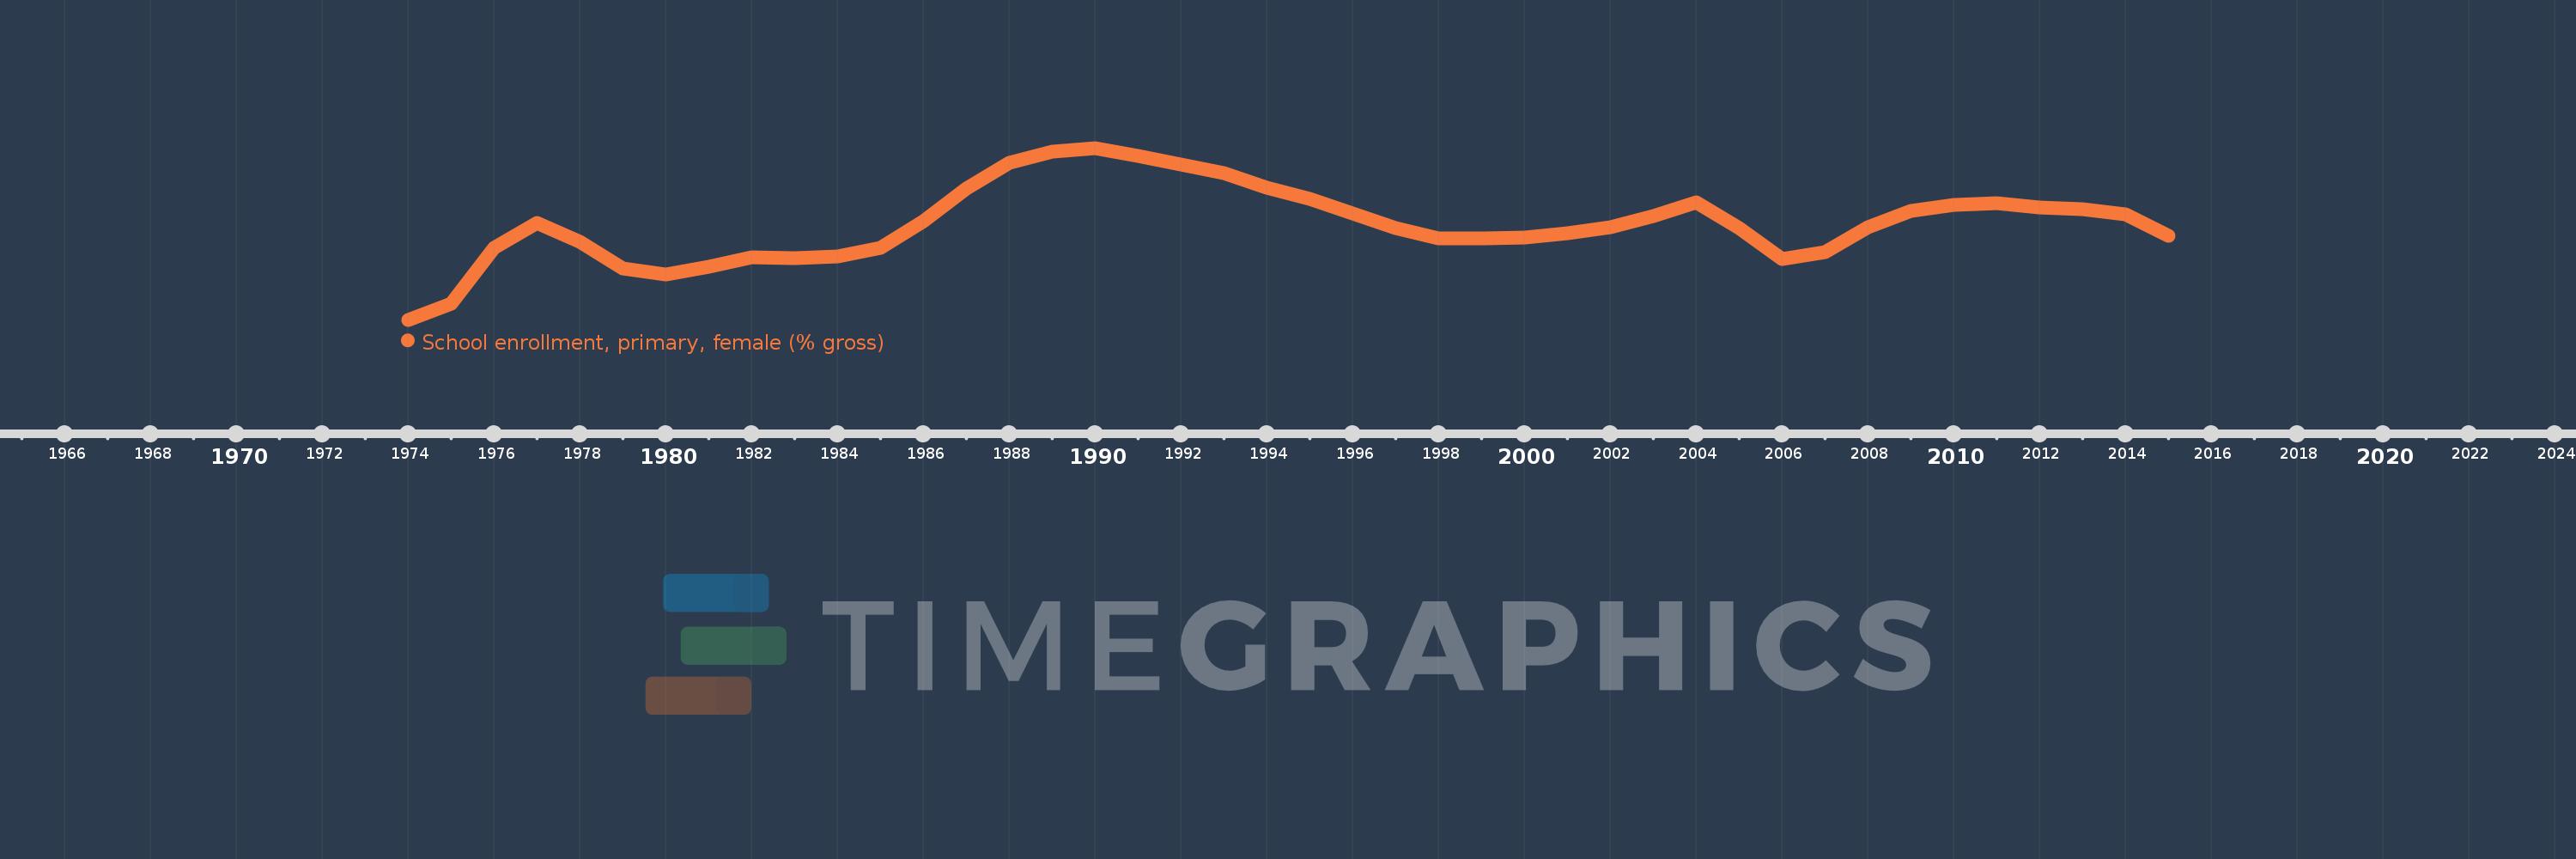
School enrollment, primary, female (% gross)
2015,2014,2013,2012,2011,2010,2009,2008,2007,2006,2005,2004,2003,2002,2001,2000,1999,1998,1997,1996,1995,1994,1993,1992,1991,1990,1989,1988,1987,1986,1985,1984,1983,1982,1981,1980,1979,1978,1977,1976,1975,1974
This statistics in other country:
AfghanistanAlbaniaAlgeriaAndorraAngolaAntigua and BarbudaArab WorldArgentinaArmeniaArubaAustraliaAustriaAzerbaijanBahamas, TheBahrainBangladeshBarbadosBelarusBelgiumBelizeBeninBermudaBhutanBoliviaBosnia and HerzegovinaBotswanaBrazilBrunei DarussalamBulgariaBurkina FasoBurundiCabo VerdeCambodiaCameroonCanadaCaribbean small statesCentral African RepublicCentral Europe and the BalticsChadChileChinaColombiaComorosCongo, Dem. Rep.Congo, Rep.Costa RicaCote d'IvoireCroatiaCubaCuracaoCyprusCzech RepublicDenmarkDjiboutiDominicaDominican RepublicEarly-demographic dividendEast Asia & PacificEast Asia & Pacific (excluding high income)East Asia & Pacific (IDA & IBRD countries)EcuadorEgypt, Arab Rep.El SalvadorEquatorial GuineaEritreaEstoniaEthiopiaEuro areaEurope & Central AsiaEurope & Central Asia (excluding high income)Europe & Central Asia (IDA & IBRD countries)European UnionFijiFinlandFragile and conflict affected situationsFranceGabonGambia, TheGeorgiaGermanyGhanaGreeceGrenadaGuatemalaGuineaGuinea-BissauGuyanaHaitiHeavily indebted poor countries (HIPC)High incomeHondurasHong Kong SAR, ChinaHungaryIBRD onlyIcelandIDA & IBRD totalIDA blendIDA onlyIDA totalIndiaIndonesiaIran, Islamic Rep.IraqIrelandIsraelItalyJamaicaJapanJordanKazakhstanKenyaKiribatiKorea, Dem. People’s Rep.Korea, Rep.KuwaitKyrgyz RepublicLao PDRLate-demographic dividendLatin America & Caribbean Latin America & Caribbean (excluding high income)Latin America & the Caribbean (IDA & IBRD countries)LatviaLeast developed countries: UN classificationLebanonLesothoLiberiaLibyaLiechtensteinLithuaniaLow & middle incomeLow incomeLower middle incomeLuxembourgMacao SAR, ChinaMacedonia, FYRMadagascarMalawiMaldivesMaliMaltaMarshall IslandsMauritaniaMauritiusMexicoMicronesia, Fed. Sts.Middle East & North AfricaMiddle East & North Africa (excluding high income)Middle East & North Africa (IDA & IBRD countries)Middle incomeMoldovaMongoliaMontenegroMoroccoMozambiqueMyanmarNamibiaNauruNepalNetherlandsNew ZealandNicaraguaNigerNigeriaNorth AmericaNorwayOECD membersOmanOther small statesPacific island small statesPakistanPalauPanamaPapua New GuineaParaguayPeruPhilippinesPolandPortugalPost-demographic dividendPre-demographic dividendPuerto RicoQatarRomaniaRussian FederationRwandaSamoaSan MarinoSao Tome and PrincipeSaudi ArabiaSenegalSerbiaSeychellesSierra LeoneSlovak RepublicSloveniaSmall statesSolomon IslandsSomaliaSouth AfricaSouth AsiaSouth Asia (IDA & IBRD)South SudanSpainSri LankaSt. Kitts and NevisSt. LuciaSt. Vincent and the GrenadinesSub-Saharan Africa Sub-Saharan Africa (excluding high income)Sub-Saharan Africa (IDA & IBRD countries)SudanSurinameSwazilandSwedenSwitzerlandSyrian Arab RepublicTajikistanTanzaniaThailandTimor-LesteTogoTongaTrinidad and TobagoTunisiaTurkeyTurkmenistanTuvaluUgandaUkraineUnited Arab EmiratesUnited KingdomUnited StatesUpper middle incomeUruguayUzbekistanVanuatuVenezuela, RBVietnamWest Bank and GazaWorldYemen, Rep.ZambiaZimbabwe Timeline:
This timeline shows a graph from 1974 to 2015 of East Asia & Pacific (excluding high income). No data until 1973. Number of actual observations by date: 42.
Source name:
World Development Indicators
Source organization:
United Nations Educational, Scientific, and Cultural Organization (UNESCO) Institute for Statistics.
Categories, topics:
Education, Gender
Last updated:
apr 23, 2017
Indicators value changes by year
Minimum:
94.478
jan 1, 1974
Maximum:
116.396
jan 1, 1990
At the date of observation
Value
Absolute change
Change from previous value
jan 1, 1974
94.478
+94.478
0.0%
jan 1, 1975
96.473
+1.995
2.11%
jan 1, 1976
103.666
+7.193
7.46%
jan 1, 1977
106.781
+3.115
3.0%
jan 1, 1978
104.41
-2.37
-2.22%
jan 1, 1979
101.013
-3.398
-3.25%
jan 1, 1980
100.239
-0.773
-0.77%
jan 1, 1981
101.259
+1.019
1.02%
jan 1, 1982
102.433
+1.175
1.16%
jan 1, 1983
102.281
-0.152
-0.15%
jan 1, 1984
102.592
+0.311
0.3%
jan 1, 1985
103.684
+1.092
1.06%
jan 1, 1986
107.072
+3.389
3.27%
jan 1, 1987
111.164
+4.091
3.82%
jan 1, 1988
114.484
+3.32
2.99%
jan 1, 1989
115.923
+1.439
1.26%
jan 1, 1990
116.396
+0.473
0.41%
jan 1, 1991
115.382
-1.014
-0.87%
jan 1, 1992
114.284
-1.098
-0.95%
jan 1, 1993
113.174
-1.11
-0.97%
jan 1, 1994
111.313
-1.861
-1.64%
jan 1, 1995
109.86
-1.453
-1.31%
jan 1, 1996
108.06
-1.8
-1.64%
jan 1, 1997
106.145
-1.914
-1.77%
jan 1, 1998
104.889
-1.256
-1.18%
jan 1, 1999
104.872
-0.017
-0.02%
jan 1, 2000
104.933
+0.061
0.06%
jan 1, 2001
105.487
+0.554
0.53%
jan 1, 2002
106.235
+0.748
0.71%
jan 1, 2003
107.714
+1.479
1.39%
jan 1, 2004
109.477
+1.762
1.64%
jan 1, 2005
106.167
-3.31
-3.02%
jan 1, 2006
102.257
-3.909
-3.68%
jan 1, 2007
103.144
+0.887
0.87%
jan 1, 2008
106.244
+3.1
3.01%
jan 1, 2009
108.363
+2.119
1.99%
jan 1, 2010
109.174
+0.81
0.75%
jan 1, 2011
109.311
+0.138
0.13%
jan 1, 2012
108.832
-0.479
-0.44%
jan 1, 2013
108.635
-0.197
-0.18%
jan 1, 2014
107.87
-0.765
-0.7%
jan 1, 2015
105.224
-2.646
-2.45%
Ranking of countries by current statistics by years


Comments: