29
/
en
AIzaSyAYiBZKx7MnpbEhh9jyipgxe19OcubqV5w
April 1, 2024
41055
Late-demographic dividend
LTE
false
2
1
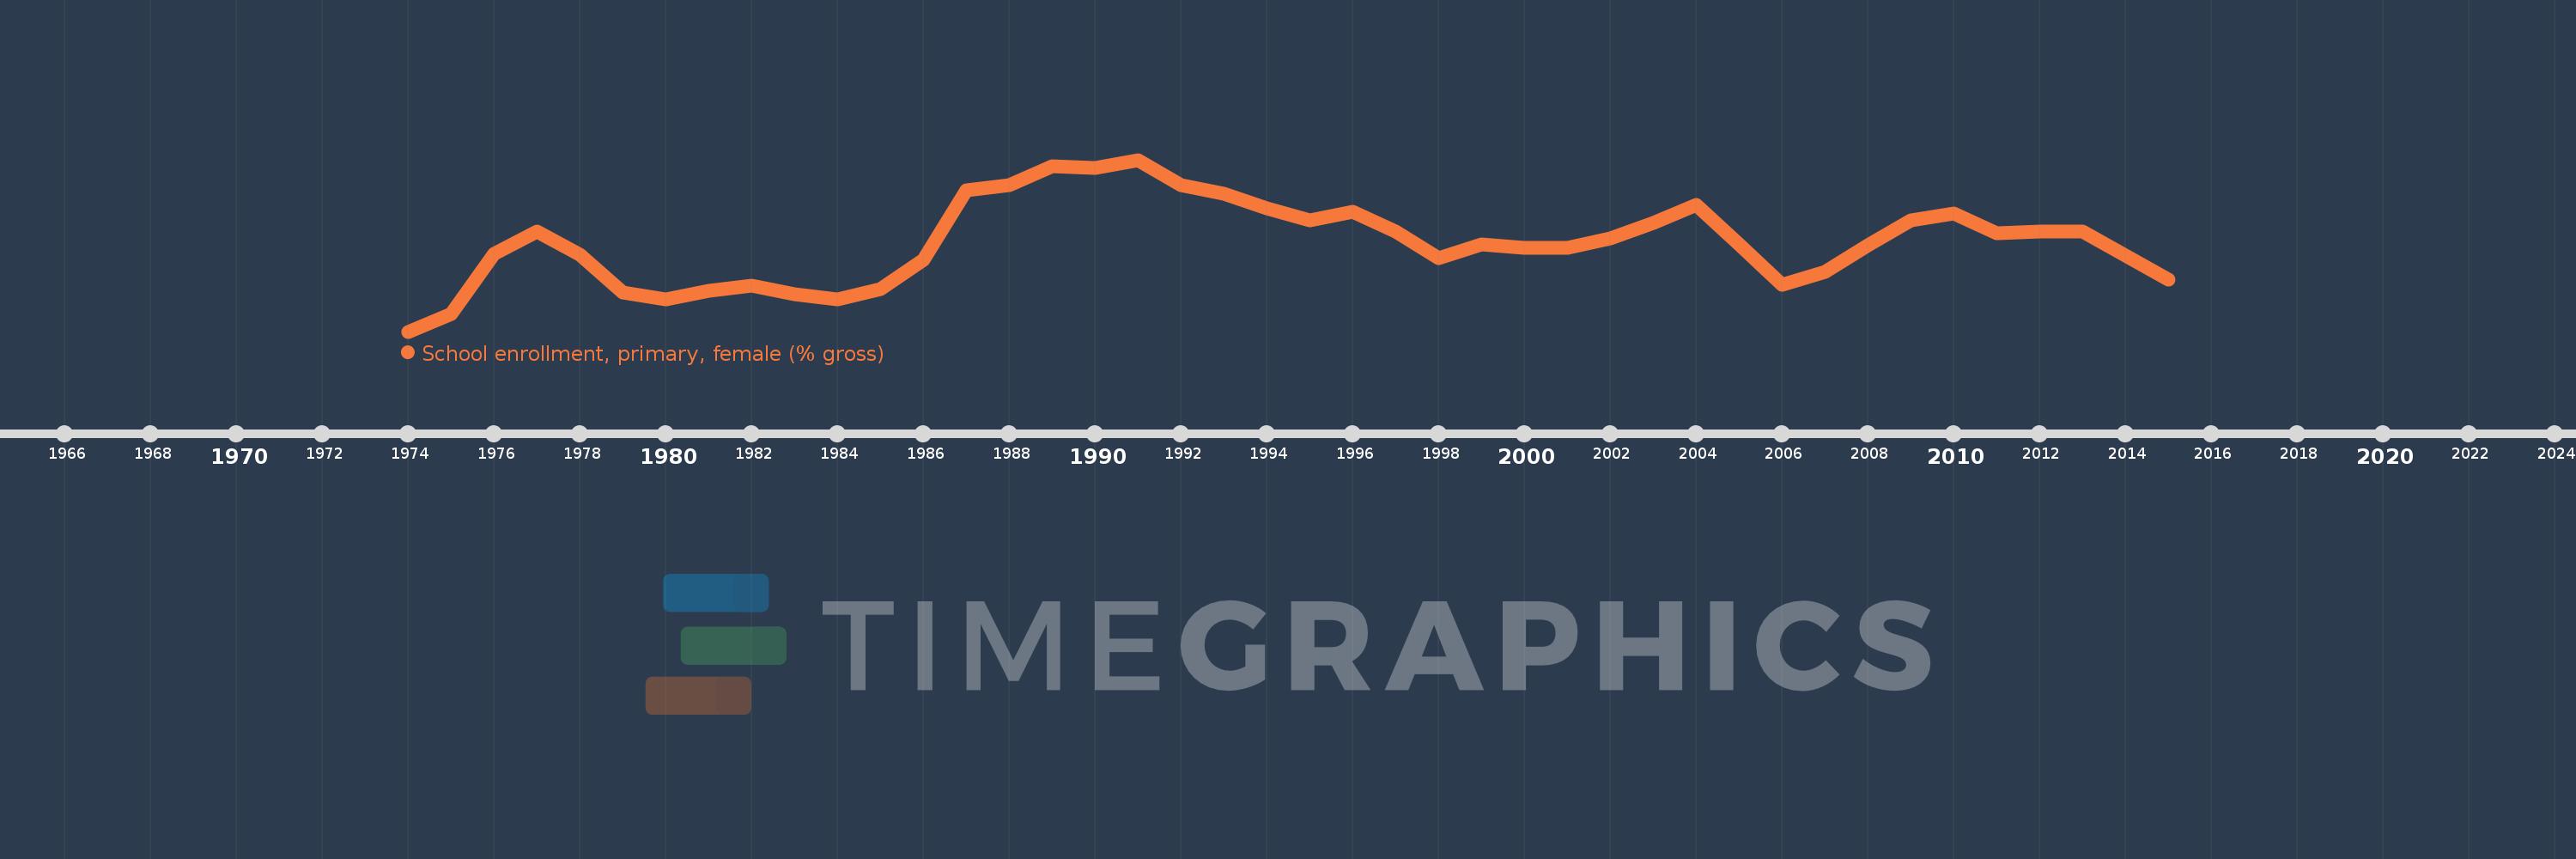
School enrollment, primary, female (% gross)
2015,2014,2013,2012,2011,2010,2009,2008,2007,2006,2005,2004,2003,2002,2001,2000,1999,1998,1997,1996,1995,1994,1993,1992,1991,1990,1989,1988,1987,1986,1985,1984,1983,1982,1981,1980,1979,1978,1977,1976,1975,1974
This statistics in other country:
AfghanistanAlbaniaAlgeriaAndorraAngolaAntigua and BarbudaArab WorldArgentinaArmeniaArubaAustraliaAustriaAzerbaijanBahamas, TheBahrainBangladeshBarbadosBelarusBelgiumBelizeBeninBermudaBhutanBoliviaBosnia and HerzegovinaBotswanaBrazilBrunei DarussalamBulgariaBurkina FasoBurundiCabo VerdeCambodiaCameroonCanadaCaribbean small statesCentral African RepublicCentral Europe and the BalticsChadChileChinaColombiaComorosCongo, Dem. Rep.Congo, Rep.Costa RicaCote d'IvoireCroatiaCubaCuracaoCyprusCzech RepublicDenmarkDjiboutiDominicaDominican RepublicEarly-demographic dividendEast Asia & PacificEast Asia & Pacific (excluding high income)East Asia & Pacific (IDA & IBRD countries)EcuadorEgypt, Arab Rep.El SalvadorEquatorial GuineaEritreaEstoniaEthiopiaEuro areaEurope & Central AsiaEurope & Central Asia (excluding high income)Europe & Central Asia (IDA & IBRD countries)European UnionFijiFinlandFragile and conflict affected situationsFranceGabonGambia, TheGeorgiaGermanyGhanaGreeceGrenadaGuatemalaGuineaGuinea-BissauGuyanaHaitiHeavily indebted poor countries (HIPC)High incomeHondurasHong Kong SAR, ChinaHungaryIBRD onlyIcelandIDA & IBRD totalIDA blendIDA onlyIDA totalIndiaIndonesiaIran, Islamic Rep.IraqIrelandIsraelItalyJamaicaJapanJordanKazakhstanKenyaKiribatiKorea, Dem. People’s Rep.Korea, Rep.KuwaitKyrgyz RepublicLao PDRLate-demographic dividendLatin America & Caribbean Latin America & Caribbean (excluding high income)Latin America & the Caribbean (IDA & IBRD countries)LatviaLeast developed countries: UN classificationLebanonLesothoLiberiaLibyaLiechtensteinLithuaniaLow & middle incomeLow incomeLower middle incomeLuxembourgMacao SAR, ChinaMacedonia, FYRMadagascarMalawiMaldivesMaliMaltaMarshall IslandsMauritaniaMauritiusMexicoMicronesia, Fed. Sts.Middle East & North AfricaMiddle East & North Africa (excluding high income)Middle East & North Africa (IDA & IBRD countries)Middle incomeMoldovaMongoliaMontenegroMoroccoMozambiqueMyanmarNamibiaNauruNepalNetherlandsNew ZealandNicaraguaNigerNigeriaNorth AmericaNorwayOECD membersOmanOther small statesPacific island small statesPakistanPalauPanamaPapua New GuineaParaguayPeruPhilippinesPolandPortugalPost-demographic dividendPre-demographic dividendPuerto RicoQatarRomaniaRussian FederationRwandaSamoaSan MarinoSao Tome and PrincipeSaudi ArabiaSenegalSerbiaSeychellesSierra LeoneSlovak RepublicSloveniaSmall statesSolomon IslandsSomaliaSouth AfricaSouth AsiaSouth Asia (IDA & IBRD)South SudanSpainSri LankaSt. Kitts and NevisSt. LuciaSt. Vincent and the GrenadinesSub-Saharan Africa Sub-Saharan Africa (excluding high income)Sub-Saharan Africa (IDA & IBRD countries)SudanSurinameSwazilandSwedenSwitzerlandSyrian Arab RepublicTajikistanTanzaniaThailandTimor-LesteTogoTongaTrinidad and TobagoTunisiaTurkeyTurkmenistanTuvaluUgandaUkraineUnited Arab EmiratesUnited KingdomUnited StatesUpper middle incomeUruguayUzbekistanVanuatuVenezuela, RBVietnamWest Bank and GazaWorldYemen, Rep.ZambiaZimbabwe Timeline:
This timeline shows a graph from 1974 to 2015 of Late-demographic dividend. No data until 1973. Number of actual observations by date: 42.
Source name:
World Development Indicators
Source organization:
United Nations Educational, Scientific, and Cultural Organization (UNESCO) Institute for Statistics.
Categories, topics:
Education, Gender
Last updated:
apr 23, 2017
Indicators value changes by year
Minimum:
99.227
jan 1, 1974
Maximum:
116.603
jan 1, 1991
At the date of observation
Value
Absolute change
Change from previous value
jan 1, 1974
99.227
+99.227
0.0%
jan 1, 1975
100.98
+1.753
1.77%
jan 1, 1976
107.061
+6.081
6.02%
jan 1, 1977
109.312
+2.251
2.1%
jan 1, 1978
107.044
-2.268
-2.07%
jan 1, 1979
103.222
-3.822
-3.57%
jan 1, 1980
102.523
-0.699
-0.68%
jan 1, 1981
103.333
+0.81
0.79%
jan 1, 1982
103.857
+0.524
0.51%
jan 1, 1983
103.023
-0.834
-0.8%
jan 1, 1984
102.443
-0.58
-0.56%
jan 1, 1985
103.556
+1.113
1.09%
jan 1, 1986
106.459
+2.903
2.8%
jan 1, 1987
113.484
+7.026
6.6%
jan 1, 1988
114.05
+0.566
0.5%
jan 1, 1989
115.985
+1.935
1.7%
jan 1, 1990
115.76
-0.225
-0.19%
jan 1, 1991
116.603
+0.842
0.73%
jan 1, 1992
114.044
-2.559
-2.19%
jan 1, 1993
113.133
-0.911
-0.8%
jan 1, 1994
111.677
-1.456
-1.29%
jan 1, 1995
110.448
-1.229
-1.1%
jan 1, 1996
111.332
+0.884
0.8%
jan 1, 1997
109.306
-2.026
-1.82%
jan 1, 1998
106.622
-2.683
-2.45%
jan 1, 1999
108.082
+1.46
1.37%
jan 1, 2000
107.731
-0.351
-0.33%
jan 1, 2001
107.716
-0.014
-0.01%
jan 1, 2002
108.628
+0.911
0.85%
jan 1, 2003
110.226
+1.598
1.47%
jan 1, 2004
112.054
+1.828
1.66%
jan 1, 2005
108.041
-4.013
-3.58%
jan 1, 2006
103.934
-4.107
-3.8%
jan 1, 2007
105.253
+1.319
1.27%
jan 1, 2008
107.973
+2.721
2.58%
jan 1, 2009
110.446
+2.473
2.29%
jan 1, 2010
111.177
+0.731
0.66%
jan 1, 2011
109.196
-1.981
-1.78%
jan 1, 2012
109.352
+0.156
0.14%
jan 1, 2013
109.366
+0.014
0.01%
jan 1, 2014
106.954
-2.412
-2.21%
jan 1, 2015
104.517
-2.437
-2.28%
Ranking of countries by current statistics by years


Comments: