29
/
en
AIzaSyAYiBZKx7MnpbEhh9jyipgxe19OcubqV5w
April 1, 2024
261587
Tanzania
TZA
true
2
1
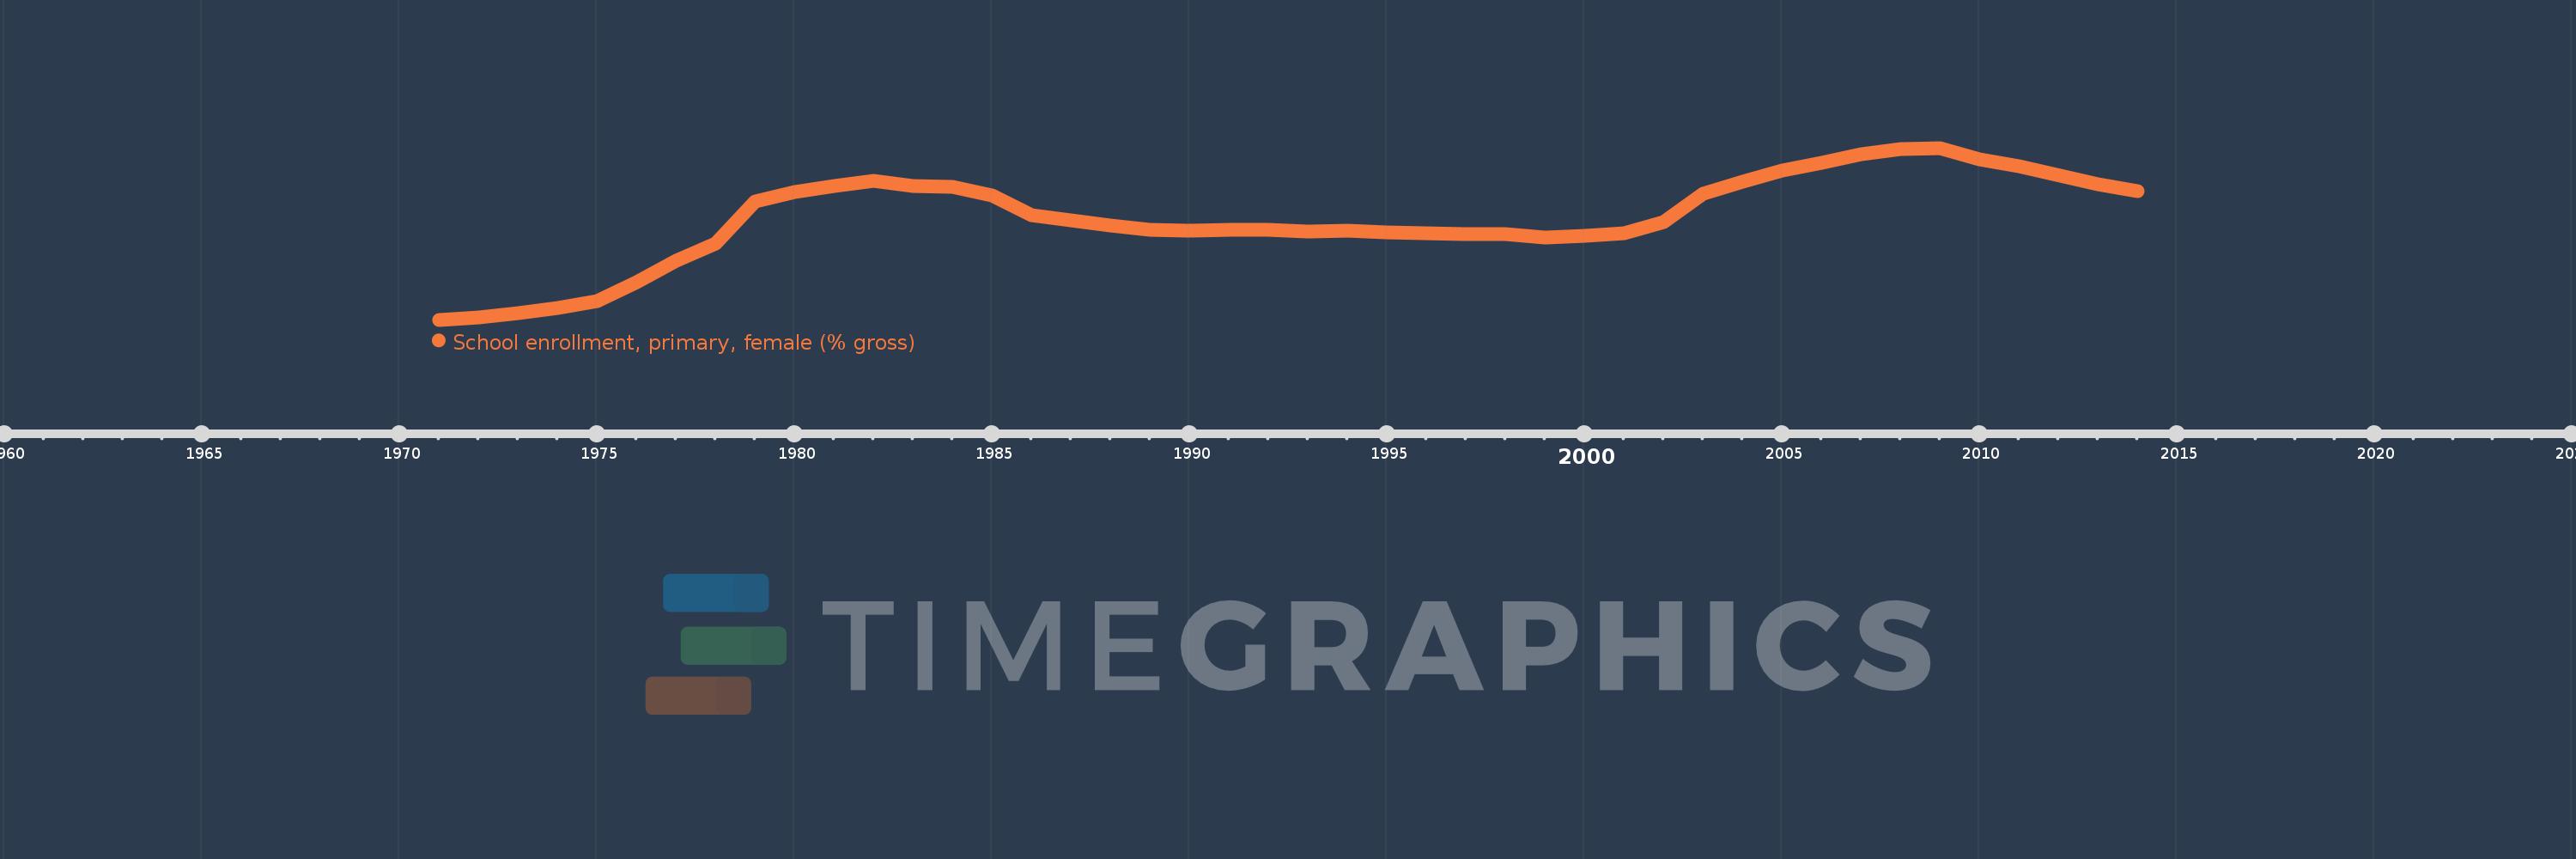
School enrollment, primary, female (% gross)
2014,2013,2011,2010,2009,2008,2007,2006,2005,2004,2003,2002,2001,2000,1999,1998,1997,1996,1995,1994,1993,1992,1991,1990,1989,1988,1987,1986,1985,1984,1983,1982,1981,1980,1979,1978,1977,1976,1975,1974,1973,1972,1971
This statistics in other country:
AfghanistanAlbaniaAlgeriaAndorraAngolaAntigua and BarbudaArab WorldArgentinaArmeniaArubaAustraliaAustriaAzerbaijanBahamas, TheBahrainBangladeshBarbadosBelarusBelgiumBelizeBeninBermudaBhutanBoliviaBosnia and HerzegovinaBotswanaBrazilBrunei DarussalamBulgariaBurkina FasoBurundiCabo VerdeCambodiaCameroonCanadaCaribbean small statesCentral African RepublicCentral Europe and the BalticsChadChileChinaColombiaComorosCongo, Dem. Rep.Congo, Rep.Costa RicaCote d'IvoireCroatiaCubaCuracaoCyprusCzech RepublicDenmarkDjiboutiDominicaDominican RepublicEarly-demographic dividendEast Asia & PacificEast Asia & Pacific (excluding high income)East Asia & Pacific (IDA & IBRD countries)EcuadorEgypt, Arab Rep.El SalvadorEquatorial GuineaEritreaEstoniaEthiopiaEuro areaEurope & Central AsiaEurope & Central Asia (excluding high income)Europe & Central Asia (IDA & IBRD countries)European UnionFijiFinlandFragile and conflict affected situationsFranceGabonGambia, TheGeorgiaGermanyGhanaGreeceGrenadaGuatemalaGuineaGuinea-BissauGuyanaHaitiHeavily indebted poor countries (HIPC)High incomeHondurasHong Kong SAR, ChinaHungaryIBRD onlyIcelandIDA & IBRD totalIDA blendIDA onlyIDA totalIndiaIndonesiaIran, Islamic Rep.IraqIrelandIsraelItalyJamaicaJapanJordanKazakhstanKenyaKiribatiKorea, Dem. People’s Rep.Korea, Rep.KuwaitKyrgyz RepublicLao PDRLate-demographic dividendLatin America & Caribbean Latin America & Caribbean (excluding high income)Latin America & the Caribbean (IDA & IBRD countries)LatviaLeast developed countries: UN classificationLebanonLesothoLiberiaLibyaLiechtensteinLithuaniaLow & middle incomeLow incomeLower middle incomeLuxembourgMacao SAR, ChinaMacedonia, FYRMadagascarMalawiMaldivesMaliMaltaMarshall IslandsMauritaniaMauritiusMexicoMicronesia, Fed. Sts.Middle East & North AfricaMiddle East & North Africa (excluding high income)Middle East & North Africa (IDA & IBRD countries)Middle incomeMoldovaMongoliaMontenegroMoroccoMozambiqueMyanmarNamibiaNauruNepalNetherlandsNew ZealandNicaraguaNigerNigeriaNorth AmericaNorwayOECD membersOmanOther small statesPacific island small statesPakistanPalauPanamaPapua New GuineaParaguayPeruPhilippinesPolandPortugalPost-demographic dividendPre-demographic dividendPuerto RicoQatarRomaniaRussian FederationRwandaSamoaSan MarinoSao Tome and PrincipeSaudi ArabiaSenegalSerbiaSeychellesSierra LeoneSlovak RepublicSloveniaSmall statesSolomon IslandsSomaliaSouth AfricaSouth AsiaSouth Asia (IDA & IBRD)South SudanSpainSri LankaSt. Kitts and NevisSt. LuciaSt. Vincent and the GrenadinesSub-Saharan Africa Sub-Saharan Africa (excluding high income)Sub-Saharan Africa (IDA & IBRD countries)SudanSurinameSwazilandSwedenSwitzerlandSyrian Arab RepublicTajikistanTanzaniaThailandTimor-LesteTogoTongaTrinidad and TobagoTunisiaTurkeyTurkmenistanTuvaluUgandaUkraineUnited Arab EmiratesUnited KingdomUnited StatesUpper middle incomeUruguayUzbekistanVanuatuVenezuela, RBVietnamWest Bank and GazaWorldYemen, Rep.ZambiaZimbabwe Timeline:
This timeline shows a graph from 1971 to 2014 of Tanzania. No data until 1970. Number of actual observations by date: 43.
Source name:
World Development Indicators
Source organization:
United Nations Educational, Scientific, and Cultural Organization (UNESCO) Institute for Statistics.
Categories, topics:
Education, Gender
Last updated:
apr 23, 2017
Indicators value changes by year
Minimum:
26.621
jan 1, 1971
Maximum:
107.872
jan 1, 2009
At the date of observation
Value
Absolute change
Change from previous value
jan 1, 1971
26.621
+26.621
0.0%
jan 1, 1972
27.722
+1.1
4.13%
jan 1, 1973
29.673
+1.951
7.04%
jan 1, 1974
32.155
+2.482
8.36%
jan 1, 1975
35.357
+3.202
9.96%
jan 1, 1976
44.532
+9.176
25.95%
jan 1, 1977
54.431
+9.898
22.23%
jan 1, 1978
62.834
+8.404
15.44%
jan 1, 1979
82.436
+19.602
31.2%
jan 1, 1980
87.092
+4.656
5.65%
jan 1, 1981
89.776
+2.684
3.08%
jan 1, 1982
92.456
+2.68
2.99%
jan 1, 1983
89.919
-2.537
-2.74%
jan 1, 1984
89.51
-0.409
-0.45%
jan 1, 1985
85.547
-3.963
-4.43%
jan 1, 1986
75.996
-9.551
-11.17%
jan 1, 1987
73.674
-2.322
-3.06%
jan 1, 1988
71.126
-2.548
-3.46%
jan 1, 1989
68.963
-2.163
-3.04%
jan 1, 1990
68.622
-0.342
-0.5%
jan 1, 1991
69.111
+0.489
0.71%
jan 1, 1992
69.307
+0.196
0.28%
jan 1, 1993
68.404
-0.903
-1.3%
jan 1, 1994
68.722
+0.318
0.46%
jan 1, 1995
67.943
-0.779
-1.13%
jan 1, 1996
67.568
-0.375
-0.55%
jan 1, 1997
66.928
-0.64
-0.95%
jan 1, 1998
67.321
+0.393
0.59%
jan 1, 1999
65.484
-1.837
-2.73%
jan 1, 2000
66.485
+1.0
1.53%
jan 1, 2001
67.465
+0.98
1.47%
jan 1, 2002
72.879
+5.414
8.03%
jan 1, 2003
86.415
+13.536
18.57%
jan 1, 2004
91.984
+5.569
6.44%
jan 1, 2005
97.031
+5.047
5.49%
jan 1, 2006
100.979
+3.948
4.07%
jan 1, 2007
104.874
+3.895
3.86%
jan 1, 2008
107.257
+2.383
2.27%
jan 1, 2009
107.872
+0.615
0.57%
jan 1, 2010
102.537
-5.336
-4.95%
jan 1, 2011
99.288
-3.249
-3.17%
jan 1, 2013
90.541
-8.747
-8.81%
jan 1, 2014
87.38
-3.161
-3.49%
Ranking of countries by current statistics by years


Comments: