29
/
en
AIzaSyAYiBZKx7MnpbEhh9jyipgxe19OcubqV5w
April 1, 2024
124183
Ecuador
ECU
true
2
1
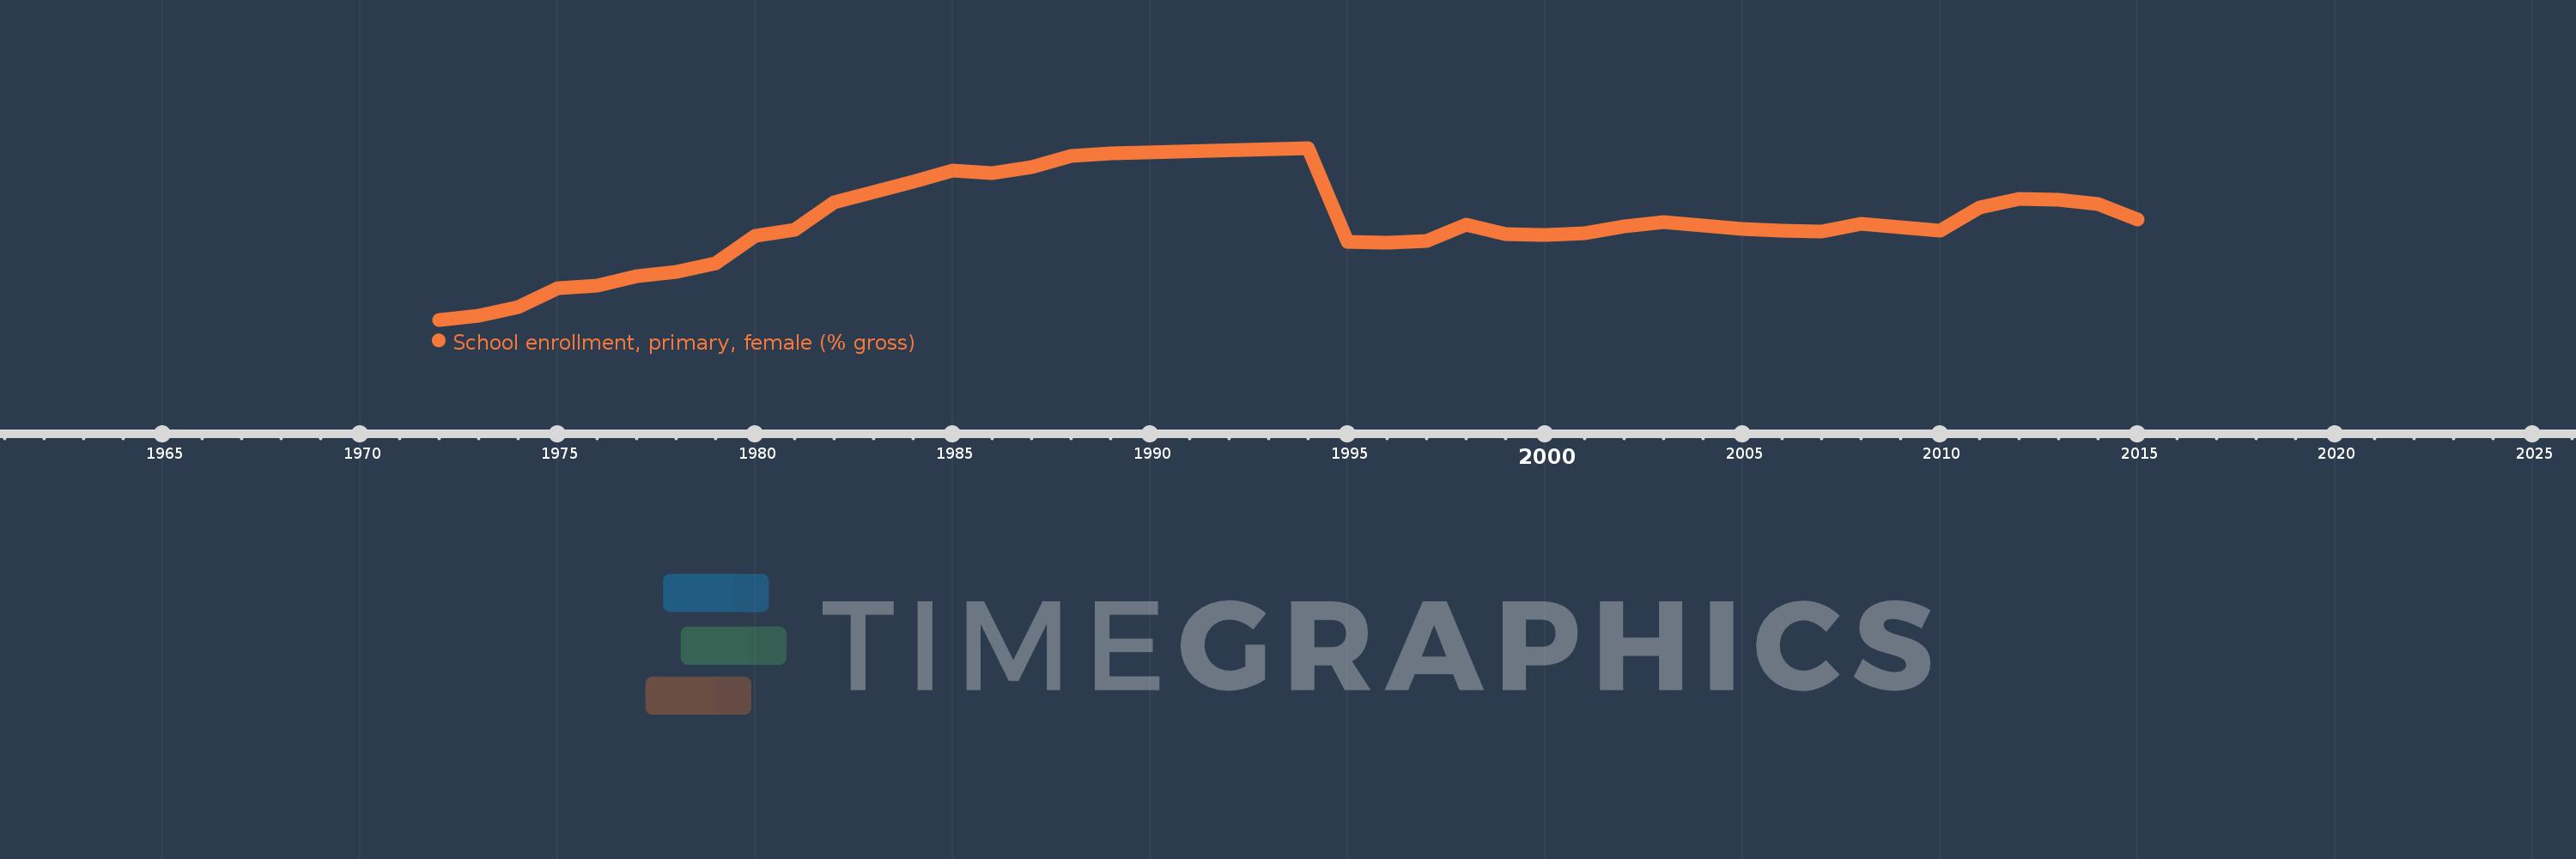
School enrollment, primary, female (% gross)
2015,2014,2013,2012,2011,2010,2008,2007,2006,2005,2004,2003,2002,2001,2000,1999,1998,1997,1996,1995,1994,1989,1988,1987,1986,1985,1984,1982,1981,1980,1979,1978,1977,1976,1975,1974,1973,1972
This statistics in other country:
AfghanistanAlbaniaAlgeriaAndorraAngolaAntigua and BarbudaArab WorldArgentinaArmeniaArubaAustraliaAustriaAzerbaijanBahamas, TheBahrainBangladeshBarbadosBelarusBelgiumBelizeBeninBermudaBhutanBoliviaBosnia and HerzegovinaBotswanaBrazilBrunei DarussalamBulgariaBurkina FasoBurundiCabo VerdeCambodiaCameroonCanadaCaribbean small statesCentral African RepublicCentral Europe and the BalticsChadChileChinaColombiaComorosCongo, Dem. Rep.Congo, Rep.Costa RicaCote d'IvoireCroatiaCubaCuracaoCyprusCzech RepublicDenmarkDjiboutiDominicaDominican RepublicEarly-demographic dividendEast Asia & PacificEast Asia & Pacific (excluding high income)East Asia & Pacific (IDA & IBRD countries)EcuadorEgypt, Arab Rep.El SalvadorEquatorial GuineaEritreaEstoniaEthiopiaEuro areaEurope & Central AsiaEurope & Central Asia (excluding high income)Europe & Central Asia (IDA & IBRD countries)European UnionFijiFinlandFragile and conflict affected situationsFranceGabonGambia, TheGeorgiaGermanyGhanaGreeceGrenadaGuatemalaGuineaGuinea-BissauGuyanaHaitiHeavily indebted poor countries (HIPC)High incomeHondurasHong Kong SAR, ChinaHungaryIBRD onlyIcelandIDA & IBRD totalIDA blendIDA onlyIDA totalIndiaIndonesiaIran, Islamic Rep.IraqIrelandIsraelItalyJamaicaJapanJordanKazakhstanKenyaKiribatiKorea, Dem. People’s Rep.Korea, Rep.KuwaitKyrgyz RepublicLao PDRLate-demographic dividendLatin America & Caribbean Latin America & Caribbean (excluding high income)Latin America & the Caribbean (IDA & IBRD countries)LatviaLeast developed countries: UN classificationLebanonLesothoLiberiaLibyaLiechtensteinLithuaniaLow & middle incomeLow incomeLower middle incomeLuxembourgMacao SAR, ChinaMacedonia, FYRMadagascarMalawiMaldivesMaliMaltaMarshall IslandsMauritaniaMauritiusMexicoMicronesia, Fed. Sts.Middle East & North AfricaMiddle East & North Africa (excluding high income)Middle East & North Africa (IDA & IBRD countries)Middle incomeMoldovaMongoliaMontenegroMoroccoMozambiqueMyanmarNamibiaNauruNepalNetherlandsNew ZealandNicaraguaNigerNigeriaNorth AmericaNorwayOECD membersOmanOther small statesPacific island small statesPakistanPalauPanamaPapua New GuineaParaguayPeruPhilippinesPolandPortugalPost-demographic dividendPre-demographic dividendPuerto RicoQatarRomaniaRussian FederationRwandaSamoaSan MarinoSao Tome and PrincipeSaudi ArabiaSenegalSerbiaSeychellesSierra LeoneSlovak RepublicSloveniaSmall statesSolomon IslandsSomaliaSouth AfricaSouth AsiaSouth Asia (IDA & IBRD)South SudanSpainSri LankaSt. Kitts and NevisSt. LuciaSt. Vincent and the GrenadinesSub-Saharan Africa Sub-Saharan Africa (excluding high income)Sub-Saharan Africa (IDA & IBRD countries)SudanSurinameSwazilandSwedenSwitzerlandSyrian Arab RepublicTajikistanTanzaniaThailandTimor-LesteTogoTongaTrinidad and TobagoTunisiaTurkeyTurkmenistanTuvaluUgandaUkraineUnited Arab EmiratesUnited KingdomUnited StatesUpper middle incomeUruguayUzbekistanVanuatuVenezuela, RBVietnamWest Bank and GazaWorldYemen, Rep.ZambiaZimbabwe Timeline:
This timeline shows a graph from 1972 to 2015 of Ecuador. No data until 1971. Number of actual observations by date: 38.
Source name:
World Development Indicators
Source organization:
United Nations Educational, Scientific, and Cultural Organization (UNESCO) Institute for Statistics.
Categories, topics:
Education, Gender
Last updated:
apr 23, 2017
Indicators value changes by year
Minimum:
95.779
jan 1, 1972
Maximum:
126.09
jan 1, 1994
At the date of observation
Value
Absolute change
Change from previous value
jan 1, 1972
95.779
+95.779
0.0%
jan 1, 1973
96.439
+0.66
0.69%
jan 1, 1974
97.943
+1.504
1.56%
jan 1, 1975
101.311
+3.368
3.44%
jan 1, 1976
101.722
+0.411
0.41%
jan 1, 1977
103.423
+1.701
1.67%
jan 1, 1978
104.284
+0.861
0.83%
jan 1, 1979
105.764
+1.48
1.42%
jan 1, 1980
110.584
+4.821
4.56%
jan 1, 1981
111.685
+1.101
1.0%
jan 1, 1982
116.501
+4.816
4.31%
jan 1, 1984
120.185
+3.684
3.16%
jan 1, 1985
122.108
+1.923
1.6%
jan 1, 1986
121.665
-0.443
-0.36%
jan 1, 1987
122.689
+1.025
0.84%
jan 1, 1988
124.623
+1.934
1.58%
jan 1, 1989
125.122
+0.499
0.4%
jan 1, 1994
126.09
+0.968
0.77%
jan 1, 1995
109.548
-16.542
-13.12%
jan 1, 1996
109.351
-0.197
-0.18%
jan 1, 1997
109.713
+0.361
0.33%
jan 1, 1998
112.487
+2.774
2.53%
jan 1, 1999
110.896
-1.591
-1.41%
jan 1, 2000
110.75
-0.147
-0.13%
jan 1, 2001
111.062
+0.313
0.28%
jan 1, 2002
112.29
+1.227
1.1%
jan 1, 2003
112.988
+0.698
0.62%
jan 1, 2004
112.467
-0.521
-0.46%
jan 1, 2005
111.788
-0.679
-0.6%
jan 1, 2006
111.494
-0.294
-0.26%
jan 1, 2007
111.311
-0.183
-0.16%
jan 1, 2008
112.761
+1.45
1.3%
jan 1, 2010
111.551
-1.21
-1.07%
jan 1, 2011
115.595
+4.044
3.63%
jan 1, 2012
117.129
+1.534
1.33%
jan 1, 2013
117.013
-0.116
-0.1%
jan 1, 2014
116.184
-0.829
-0.71%
jan 1, 2015
113.401
-2.784
-2.4%
Ranking of countries by current statistics by years


Comments: