29
/
en
AIzaSyAYiBZKx7MnpbEhh9jyipgxe19OcubqV5w
April 1, 2024
60355
Sub-Saharan Africa (excluding high income)
SSA
false
2
1
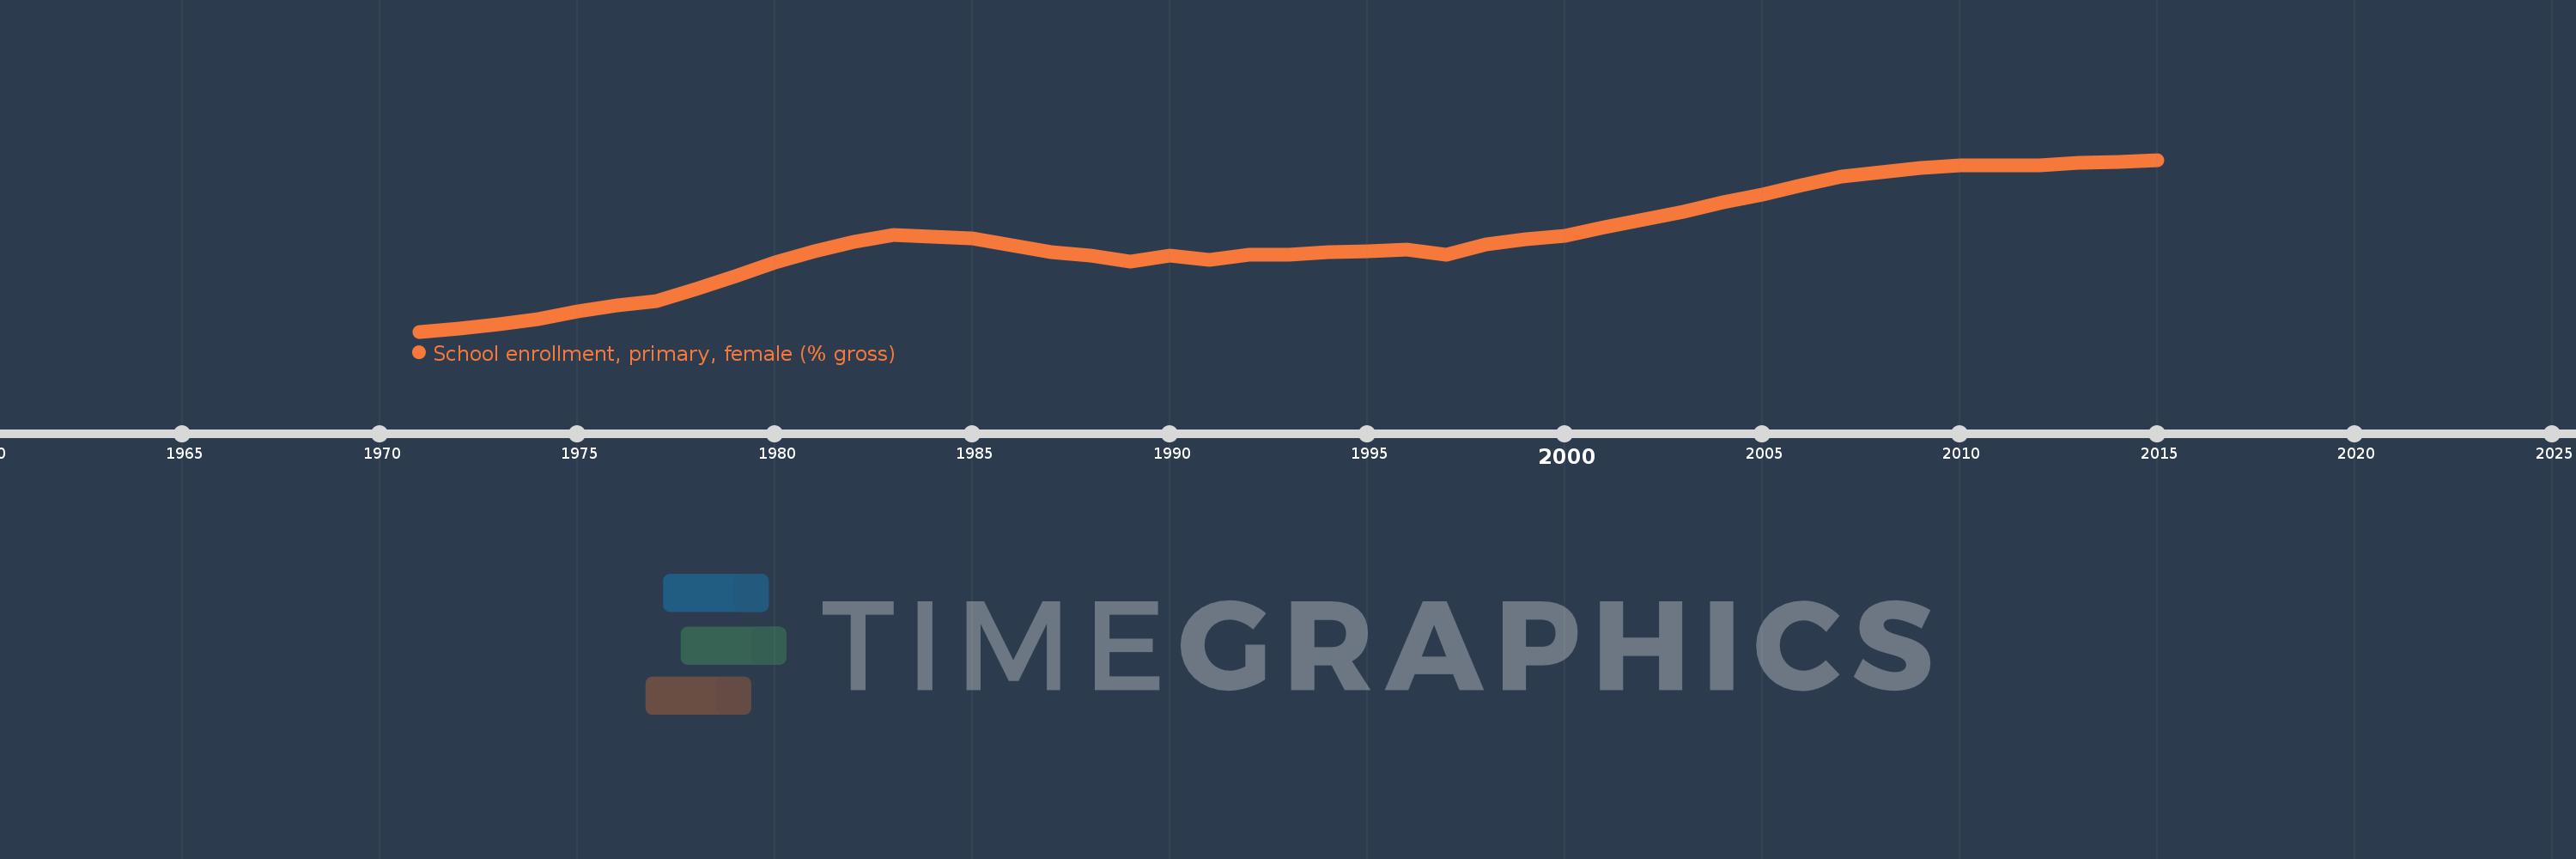
School enrollment, primary, female (% gross)
2015,2014,2013,2012,2011,2010,2009,2008,2007,2006,2005,2004,2003,2002,2001,2000,1999,1998,1997,1996,1995,1994,1993,1992,1991,1990,1989,1988,1987,1986,1985,1984,1983,1982,1981,1980,1979,1978,1977,1976,1975,1974,1973,1972,1971
This statistics in other country:
AfghanistanAlbaniaAlgeriaAndorraAngolaAntigua and BarbudaArab WorldArgentinaArmeniaArubaAustraliaAustriaAzerbaijanBahamas, TheBahrainBangladeshBarbadosBelarusBelgiumBelizeBeninBermudaBhutanBoliviaBosnia and HerzegovinaBotswanaBrazilBrunei DarussalamBulgariaBurkina FasoBurundiCabo VerdeCambodiaCameroonCanadaCaribbean small statesCentral African RepublicCentral Europe and the BalticsChadChileChinaColombiaComorosCongo, Dem. Rep.Congo, Rep.Costa RicaCote d'IvoireCroatiaCubaCuracaoCyprusCzech RepublicDenmarkDjiboutiDominicaDominican RepublicEarly-demographic dividendEast Asia & PacificEast Asia & Pacific (excluding high income)East Asia & Pacific (IDA & IBRD countries)EcuadorEgypt, Arab Rep.El SalvadorEquatorial GuineaEritreaEstoniaEthiopiaEuro areaEurope & Central AsiaEurope & Central Asia (excluding high income)Europe & Central Asia (IDA & IBRD countries)European UnionFijiFinlandFragile and conflict affected situationsFranceGabonGambia, TheGeorgiaGermanyGhanaGreeceGrenadaGuatemalaGuineaGuinea-BissauGuyanaHaitiHeavily indebted poor countries (HIPC)High incomeHondurasHong Kong SAR, ChinaHungaryIBRD onlyIcelandIDA & IBRD totalIDA blendIDA onlyIDA totalIndiaIndonesiaIran, Islamic Rep.IraqIrelandIsraelItalyJamaicaJapanJordanKazakhstanKenyaKiribatiKorea, Dem. People’s Rep.Korea, Rep.KuwaitKyrgyz RepublicLao PDRLate-demographic dividendLatin America & Caribbean Latin America & Caribbean (excluding high income)Latin America & the Caribbean (IDA & IBRD countries)LatviaLeast developed countries: UN classificationLebanonLesothoLiberiaLibyaLiechtensteinLithuaniaLow & middle incomeLow incomeLower middle incomeLuxembourgMacao SAR, ChinaMacedonia, FYRMadagascarMalawiMaldivesMaliMaltaMarshall IslandsMauritaniaMauritiusMexicoMicronesia, Fed. Sts.Middle East & North AfricaMiddle East & North Africa (excluding high income)Middle East & North Africa (IDA & IBRD countries)Middle incomeMoldovaMongoliaMontenegroMoroccoMozambiqueMyanmarNamibiaNauruNepalNetherlandsNew ZealandNicaraguaNigerNigeriaNorth AmericaNorwayOECD membersOmanOther small statesPacific island small statesPakistanPalauPanamaPapua New GuineaParaguayPeruPhilippinesPolandPortugalPost-demographic dividendPre-demographic dividendPuerto RicoQatarRomaniaRussian FederationRwandaSamoaSan MarinoSao Tome and PrincipeSaudi ArabiaSenegalSerbiaSeychellesSierra LeoneSlovak RepublicSloveniaSmall statesSolomon IslandsSomaliaSouth AfricaSouth AsiaSouth Asia (IDA & IBRD)South SudanSpainSri LankaSt. Kitts and NevisSt. LuciaSt. Vincent and the GrenadinesSub-Saharan Africa Sub-Saharan Africa (excluding high income)Sub-Saharan Africa (IDA & IBRD countries)SudanSurinameSwazilandSwedenSwitzerlandSyrian Arab RepublicTajikistanTanzaniaThailandTimor-LesteTogoTongaTrinidad and TobagoTunisiaTurkeyTurkmenistanTuvaluUgandaUkraineUnited Arab EmiratesUnited KingdomUnited StatesUpper middle incomeUruguayUzbekistanVanuatuVenezuela, RBVietnamWest Bank and GazaWorldYemen, Rep.ZambiaZimbabwe Timeline:
This timeline shows a graph from 1971 to 2015 of Sub-Saharan Africa (excluding high income). No data until 1970. Number of actual observations by date: 45.
Source name:
World Development Indicators
Source organization:
United Nations Educational, Scientific, and Cultural Organization (UNESCO) Institute for Statistics.
Categories, topics:
Education, Gender
Last updated:
apr 23, 2017
Indicators value changes by year
Minimum:
44.765
jan 1, 1971
Maximum:
94.769
jan 1, 2015
At the date of observation
Value
Absolute change
Change from previous value
jan 1, 1971
44.765
+44.765
0.0%
jan 1, 1972
45.588
+0.823
1.84%
jan 1, 1973
46.972
+1.383
3.03%
jan 1, 1974
48.322
+1.35
2.87%
jan 1, 1975
50.64
+2.318
4.8%
jan 1, 1976
52.314
+1.674
3.31%
jan 1, 1977
53.527
+1.214
2.32%
jan 1, 1978
57.105
+3.577
6.68%
jan 1, 1979
60.797
+3.692
6.47%
jan 1, 1980
64.905
+4.108
6.76%
jan 1, 1981
68.15
+3.244
5.0%
jan 1, 1982
70.994
+2.845
4.17%
jan 1, 1983
72.775
+1.781
2.51%
jan 1, 1984
72.507
-0.268
-0.37%
jan 1, 1985
71.815
-0.692
-0.95%
jan 1, 1986
69.835
-1.98
-2.76%
jan 1, 1987
67.822
-2.014
-2.88%
jan 1, 1988
66.834
-0.987
-1.46%
jan 1, 1989
65.093
-1.741
-2.6%
jan 1, 1990
66.864
+1.771
2.72%
jan 1, 1991
65.734
-1.131
-1.69%
jan 1, 1992
67.106
+1.372
2.09%
jan 1, 1993
67.122
+0.016
0.02%
jan 1, 1994
67.898
+0.776
1.16%
jan 1, 1995
68.145
+0.247
0.36%
jan 1, 1996
68.632
+0.486
0.71%
jan 1, 1997
67.099
-1.532
-2.23%
jan 1, 1998
70.261
+3.162
4.71%
jan 1, 1999
71.699
+1.438
2.05%
jan 1, 2000
72.632
+0.933
1.3%
jan 1, 2001
75.17
+2.537
3.49%
jan 1, 2002
77.501
+2.332
3.1%
jan 1, 2003
79.566
+2.065
2.66%
jan 1, 2004
82.43
+2.864
3.6%
jan 1, 2005
84.766
+2.336
2.83%
jan 1, 2006
87.455
+2.69
3.17%
jan 1, 2007
89.804
+2.349
2.69%
jan 1, 2008
91.065
+1.261
1.4%
jan 1, 2009
92.508
+1.443
1.58%
jan 1, 2010
93.116
+0.608
0.66%
jan 1, 2011
93.153
+0.037
0.04%
jan 1, 2012
93.17
+0.017
0.02%
jan 1, 2013
93.902
+0.732
0.79%
jan 1, 2014
94.158
+0.256
0.27%
jan 1, 2015
94.769
+0.611
0.65%
Ranking of countries by current statistics by years


Comments: