29
/
en
AIzaSyAYiBZKx7MnpbEhh9jyipgxe19OcubqV5w
April 1, 2024
29487
East Asia & Pacific (IDA & IBRD countries)
TEA
false
2
1
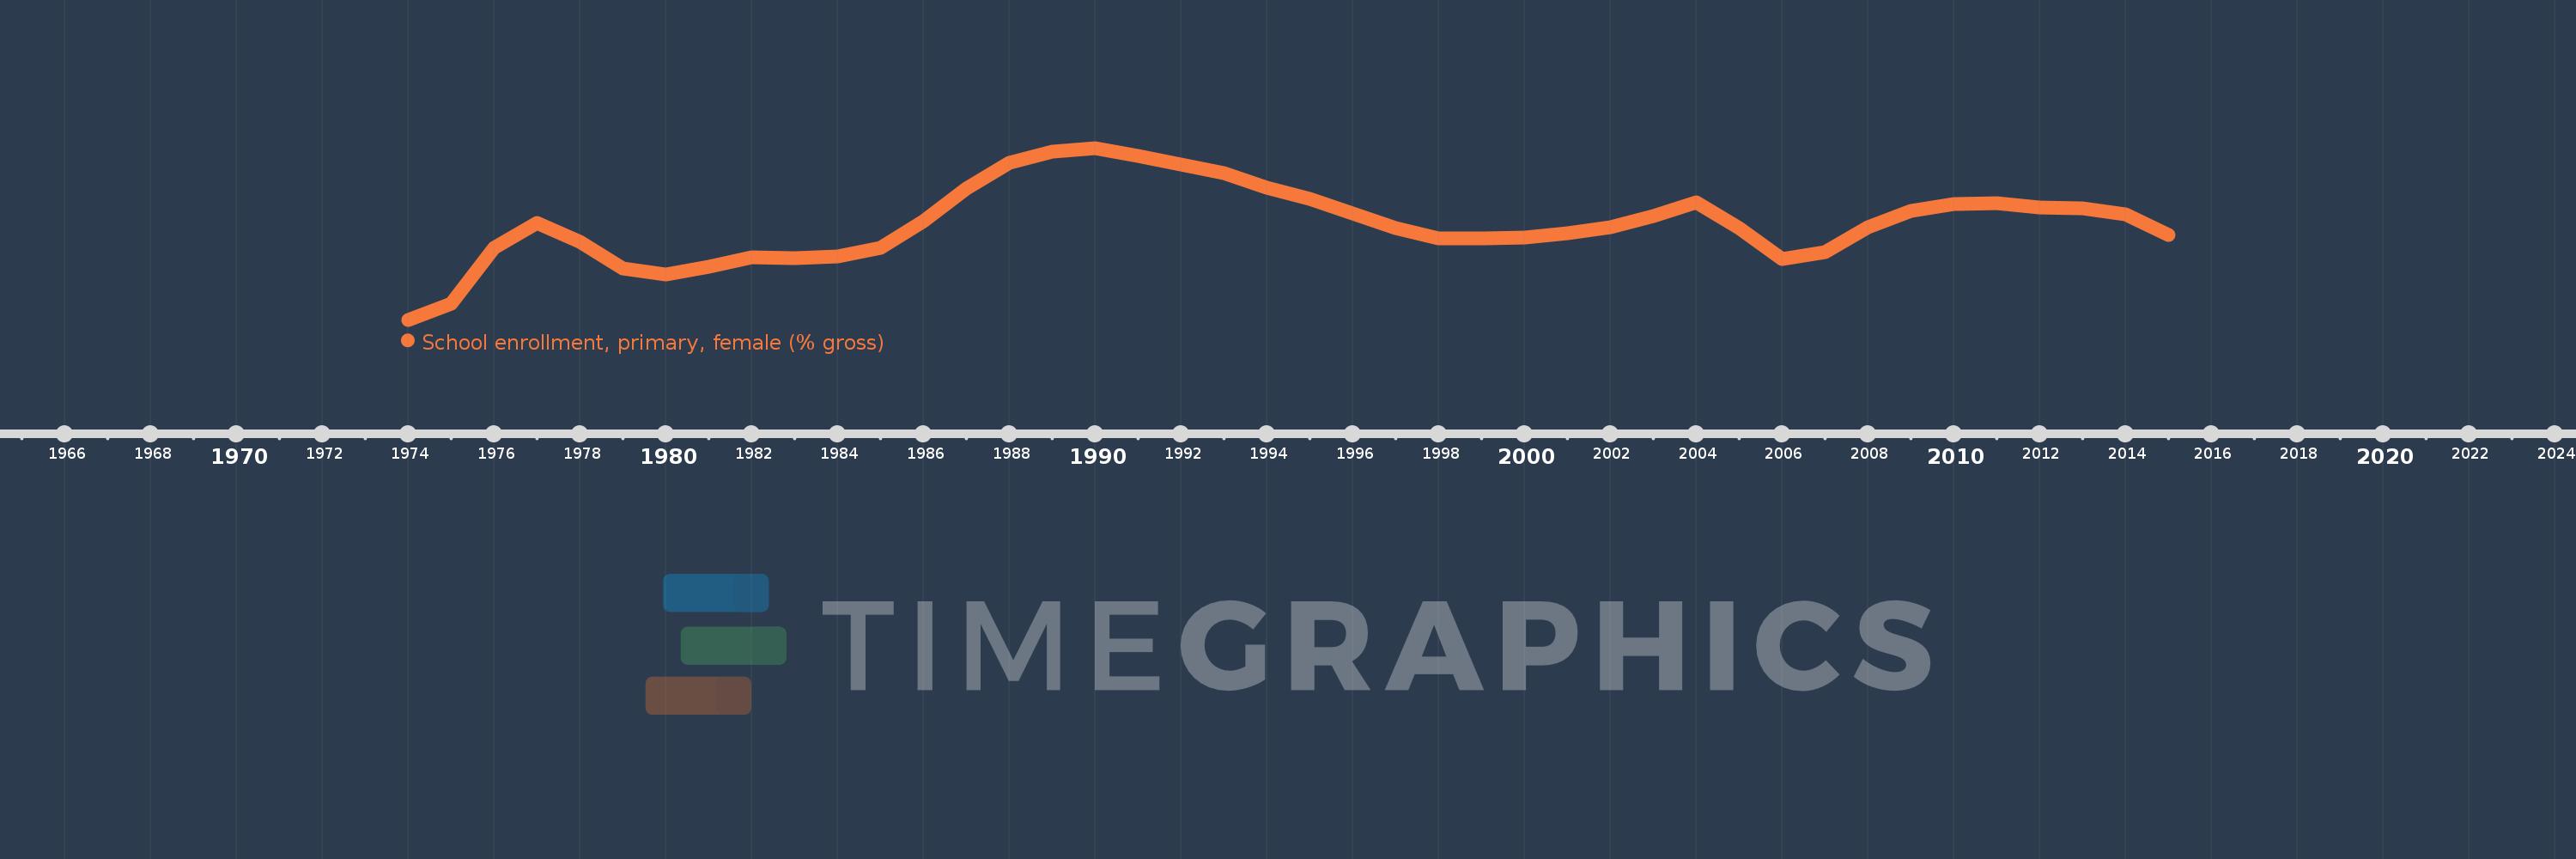
School enrollment, primary, female (% gross)
2015,2014,2013,2012,2011,2010,2009,2008,2007,2006,2005,2004,2003,2002,2001,2000,1999,1998,1997,1996,1995,1994,1993,1992,1991,1990,1989,1988,1987,1986,1985,1984,1983,1982,1981,1980,1979,1978,1977,1976,1975,1974
This statistics in other country:
AfghanistanAlbaniaAlgeriaAndorraAngolaAntigua and BarbudaArab WorldArgentinaArmeniaArubaAustraliaAustriaAzerbaijanBahamas, TheBahrainBangladeshBarbadosBelarusBelgiumBelizeBeninBermudaBhutanBoliviaBosnia and HerzegovinaBotswanaBrazilBrunei DarussalamBulgariaBurkina FasoBurundiCabo VerdeCambodiaCameroonCanadaCaribbean small statesCentral African RepublicCentral Europe and the BalticsChadChileChinaColombiaComorosCongo, Dem. Rep.Congo, Rep.Costa RicaCote d'IvoireCroatiaCubaCuracaoCyprusCzech RepublicDenmarkDjiboutiDominicaDominican RepublicEarly-demographic dividendEast Asia & PacificEast Asia & Pacific (excluding high income)East Asia & Pacific (IDA & IBRD countries)EcuadorEgypt, Arab Rep.El SalvadorEquatorial GuineaEritreaEstoniaEthiopiaEuro areaEurope & Central AsiaEurope & Central Asia (excluding high income)Europe & Central Asia (IDA & IBRD countries)European UnionFijiFinlandFragile and conflict affected situationsFranceGabonGambia, TheGeorgiaGermanyGhanaGreeceGrenadaGuatemalaGuineaGuinea-BissauGuyanaHaitiHeavily indebted poor countries (HIPC)High incomeHondurasHong Kong SAR, ChinaHungaryIBRD onlyIcelandIDA & IBRD totalIDA blendIDA onlyIDA totalIndiaIndonesiaIran, Islamic Rep.IraqIrelandIsraelItalyJamaicaJapanJordanKazakhstanKenyaKiribatiKorea, Dem. People’s Rep.Korea, Rep.KuwaitKyrgyz RepublicLao PDRLate-demographic dividendLatin America & Caribbean Latin America & Caribbean (excluding high income)Latin America & the Caribbean (IDA & IBRD countries)LatviaLeast developed countries: UN classificationLebanonLesothoLiberiaLibyaLiechtensteinLithuaniaLow & middle incomeLow incomeLower middle incomeLuxembourgMacao SAR, ChinaMacedonia, FYRMadagascarMalawiMaldivesMaliMaltaMarshall IslandsMauritaniaMauritiusMexicoMicronesia, Fed. Sts.Middle East & North AfricaMiddle East & North Africa (excluding high income)Middle East & North Africa (IDA & IBRD countries)Middle incomeMoldovaMongoliaMontenegroMoroccoMozambiqueMyanmarNamibiaNauruNepalNetherlandsNew ZealandNicaraguaNigerNigeriaNorth AmericaNorwayOECD membersOmanOther small statesPacific island small statesPakistanPalauPanamaPapua New GuineaParaguayPeruPhilippinesPolandPortugalPost-demographic dividendPre-demographic dividendPuerto RicoQatarRomaniaRussian FederationRwandaSamoaSan MarinoSao Tome and PrincipeSaudi ArabiaSenegalSerbiaSeychellesSierra LeoneSlovak RepublicSloveniaSmall statesSolomon IslandsSomaliaSouth AfricaSouth AsiaSouth Asia (IDA & IBRD)South SudanSpainSri LankaSt. Kitts and NevisSt. LuciaSt. Vincent and the GrenadinesSub-Saharan Africa Sub-Saharan Africa (excluding high income)Sub-Saharan Africa (IDA & IBRD countries)SudanSurinameSwazilandSwedenSwitzerlandSyrian Arab RepublicTajikistanTanzaniaThailandTimor-LesteTogoTongaTrinidad and TobagoTunisiaTurkeyTurkmenistanTuvaluUgandaUkraineUnited Arab EmiratesUnited KingdomUnited StatesUpper middle incomeUruguayUzbekistanVanuatuVenezuela, RBVietnamWest Bank and GazaWorldYemen, Rep.ZambiaZimbabwe Timeline:
This timeline shows a graph from 1974 to 2015 of East Asia & Pacific (IDA & IBRD countries). No data until 1973. Number of actual observations by date: 42.
Source name:
World Development Indicators
Source organization:
United Nations Educational, Scientific, and Cultural Organization (UNESCO) Institute for Statistics.
Categories, topics:
Education, Gender
Last updated:
apr 23, 2017
Indicators value changes by year
Minimum:
94.442
jan 1, 1974
Maximum:
116.53
jan 1, 1990
At the date of observation
Value
Absolute change
Change from previous value
jan 1, 1974
94.442
+94.442
0.0%
jan 1, 1975
96.453
+2.011
2.13%
jan 1, 1976
103.716
+7.264
7.53%
jan 1, 1977
106.866
+3.15
3.04%
jan 1, 1978
104.47
-2.396
-2.24%
jan 1, 1979
101.035
-3.436
-3.29%
jan 1, 1980
100.252
-0.783
-0.77%
jan 1, 1981
101.281
+1.029
1.03%
jan 1, 1982
102.467
+1.186
1.17%
jan 1, 1983
102.311
-0.155
-0.15%
jan 1, 1984
102.623
+0.312
0.3%
jan 1, 1985
103.723
+1.1
1.07%
jan 1, 1986
107.136
+3.413
3.29%
jan 1, 1987
111.255
+4.118
3.84%
jan 1, 1988
114.595
+3.34
3.0%
jan 1, 1989
116.046
+1.451
1.27%
jan 1, 1990
116.53
+0.485
0.42%
jan 1, 1991
115.519
-1.011
-0.87%
jan 1, 1992
114.42
-1.099
-0.95%
jan 1, 1993
113.304
-1.116
-0.98%
jan 1, 1994
111.426
-1.879
-1.66%
jan 1, 1995
109.955
-1.47
-1.32%
jan 1, 1996
108.134
-1.821
-1.66%
jan 1, 1997
106.2
-1.934
-1.79%
jan 1, 1998
104.932
-1.268
-1.19%
jan 1, 1999
104.914
-0.018
-0.02%
jan 1, 2000
104.977
+0.063
0.06%
jan 1, 2001
105.538
+0.561
0.53%
jan 1, 2002
106.295
+0.758
0.72%
jan 1, 2003
107.791
+1.496
1.41%
jan 1, 2004
109.574
+1.782
1.65%
jan 1, 2005
106.228
-3.346
-3.05%
jan 1, 2006
102.283
-3.945
-3.71%
jan 1, 2007
103.177
+0.895
0.87%
jan 1, 2008
106.308
+3.13
3.03%
jan 1, 2009
108.449
+2.142
2.01%
jan 1, 2010
109.269
+0.82
0.76%
jan 1, 2011
109.409
+0.14
0.13%
jan 1, 2012
108.926
-0.483
-0.44%
jan 1, 2013
108.727
-0.199
-0.18%
jan 1, 2014
107.975
-0.752
-0.69%
jan 1, 2015
105.296
-2.679
-2.48%
Ranking of countries by current statistics by years


Comments: