29
/
en
AIzaSyAYiBZKx7MnpbEhh9jyipgxe19OcubqV5w
April 1, 2024
199830
Mongolia
MNG
true
2
1
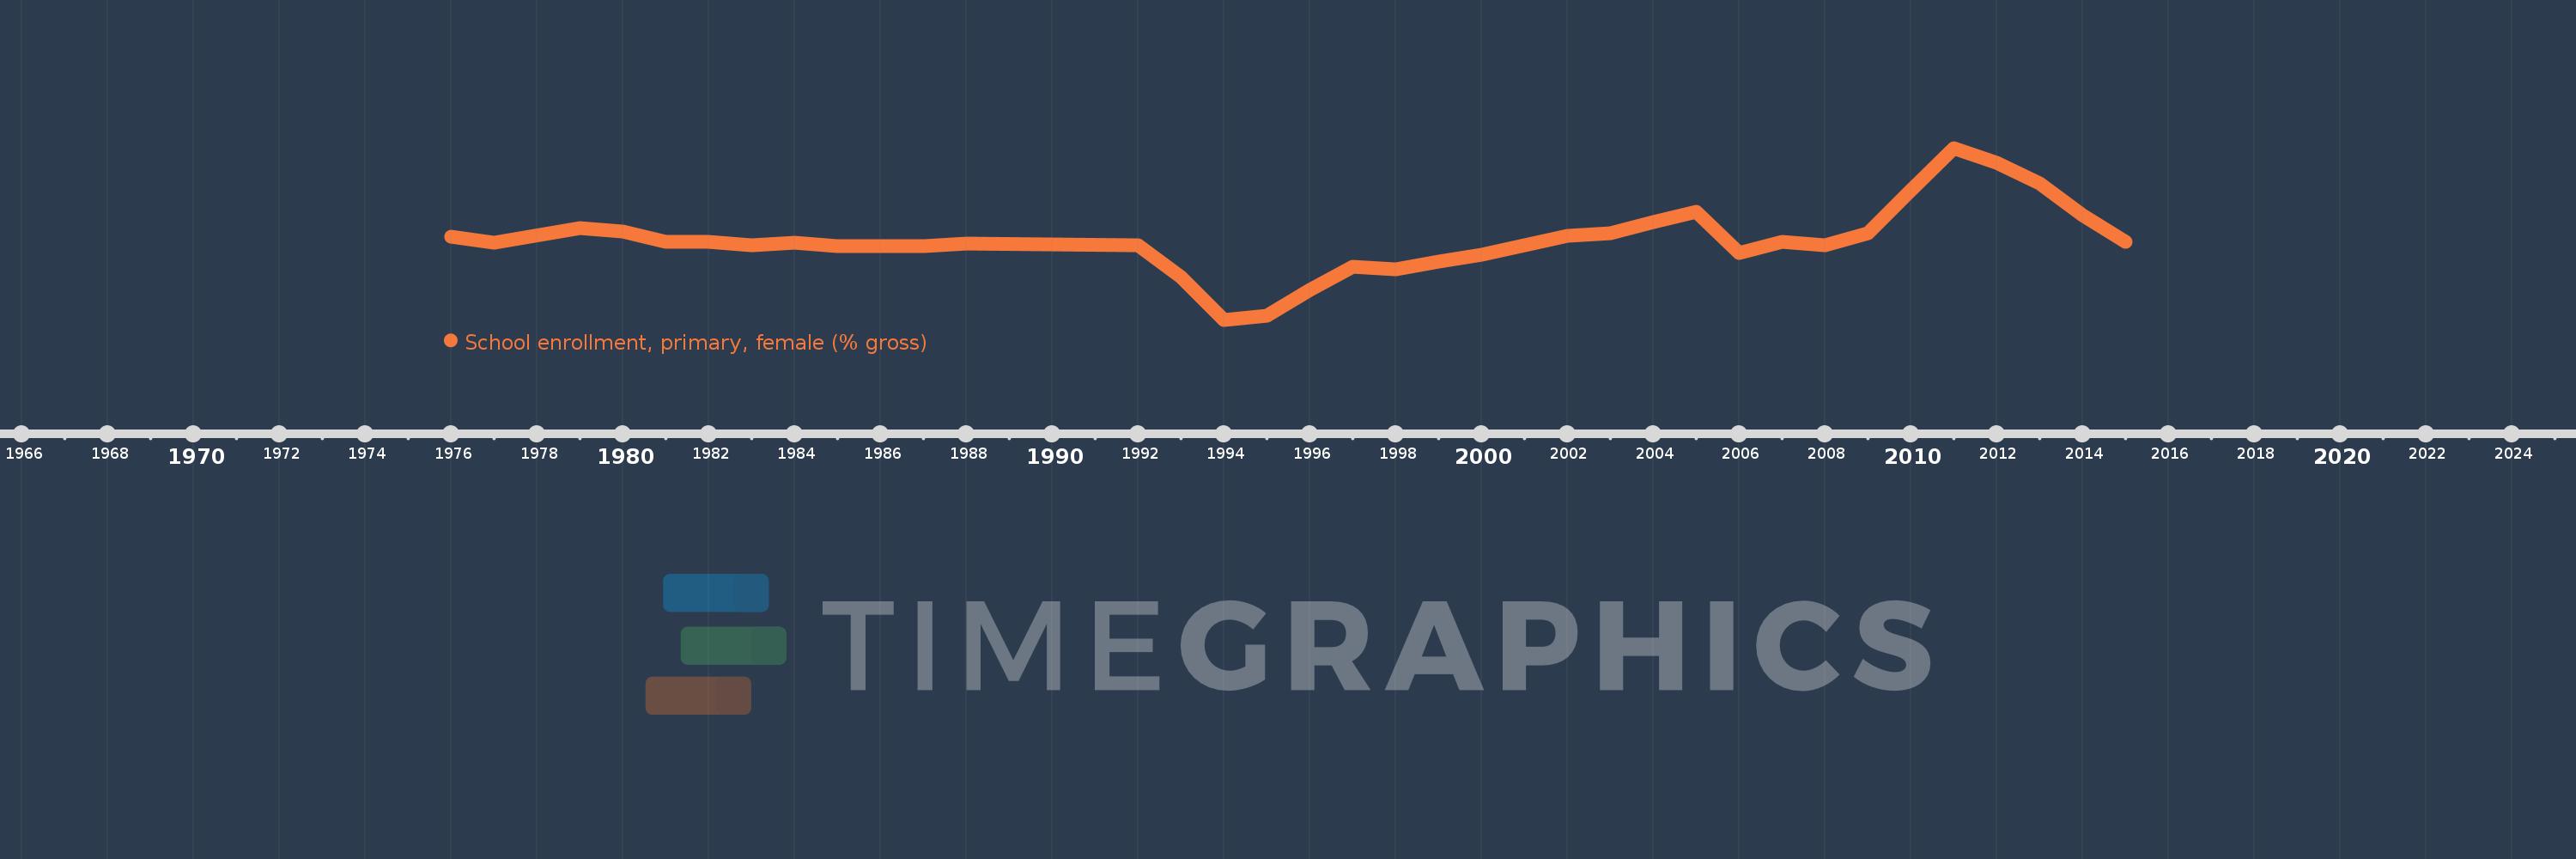
School enrollment, primary, female (% gross)
2015,2014,2013,2012,2011,2010,2009,2008,2007,2006,2005,2004,2003,2002,2001,2000,1999,1998,1997,1996,1995,1994,1993,1992,1988,1987,1986,1985,1984,1983,1982,1981,1980,1979,1977,1976
This statistics in other country:
AfghanistanAlbaniaAlgeriaAndorraAngolaAntigua and BarbudaArab WorldArgentinaArmeniaArubaAustraliaAustriaAzerbaijanBahamas, TheBahrainBangladeshBarbadosBelarusBelgiumBelizeBeninBermudaBhutanBoliviaBosnia and HerzegovinaBotswanaBrazilBrunei DarussalamBulgariaBurkina FasoBurundiCabo VerdeCambodiaCameroonCanadaCaribbean small statesCentral African RepublicCentral Europe and the BalticsChadChileChinaColombiaComorosCongo, Dem. Rep.Congo, Rep.Costa RicaCote d'IvoireCroatiaCubaCuracaoCyprusCzech RepublicDenmarkDjiboutiDominicaDominican RepublicEarly-demographic dividendEast Asia & PacificEast Asia & Pacific (excluding high income)East Asia & Pacific (IDA & IBRD countries)EcuadorEgypt, Arab Rep.El SalvadorEquatorial GuineaEritreaEstoniaEthiopiaEuro areaEurope & Central AsiaEurope & Central Asia (excluding high income)Europe & Central Asia (IDA & IBRD countries)European UnionFijiFinlandFragile and conflict affected situationsFranceGabonGambia, TheGeorgiaGermanyGhanaGreeceGrenadaGuatemalaGuineaGuinea-BissauGuyanaHaitiHeavily indebted poor countries (HIPC)High incomeHondurasHong Kong SAR, ChinaHungaryIBRD onlyIcelandIDA & IBRD totalIDA blendIDA onlyIDA totalIndiaIndonesiaIran, Islamic Rep.IraqIrelandIsraelItalyJamaicaJapanJordanKazakhstanKenyaKiribatiKorea, Dem. People’s Rep.Korea, Rep.KuwaitKyrgyz RepublicLao PDRLate-demographic dividendLatin America & Caribbean Latin America & Caribbean (excluding high income)Latin America & the Caribbean (IDA & IBRD countries)LatviaLeast developed countries: UN classificationLebanonLesothoLiberiaLibyaLiechtensteinLithuaniaLow & middle incomeLow incomeLower middle incomeLuxembourgMacao SAR, ChinaMacedonia, FYRMadagascarMalawiMaldivesMaliMaltaMarshall IslandsMauritaniaMauritiusMexicoMicronesia, Fed. Sts.Middle East & North AfricaMiddle East & North Africa (excluding high income)Middle East & North Africa (IDA & IBRD countries)Middle incomeMoldovaMongoliaMontenegroMoroccoMozambiqueMyanmarNamibiaNauruNepalNetherlandsNew ZealandNicaraguaNigerNigeriaNorth AmericaNorwayOECD membersOmanOther small statesPacific island small statesPakistanPalauPanamaPapua New GuineaParaguayPeruPhilippinesPolandPortugalPost-demographic dividendPre-demographic dividendPuerto RicoQatarRomaniaRussian FederationRwandaSamoaSan MarinoSao Tome and PrincipeSaudi ArabiaSenegalSerbiaSeychellesSierra LeoneSlovak RepublicSloveniaSmall statesSolomon IslandsSomaliaSouth AfricaSouth AsiaSouth Asia (IDA & IBRD)South SudanSpainSri LankaSt. Kitts and NevisSt. LuciaSt. Vincent and the GrenadinesSub-Saharan Africa Sub-Saharan Africa (excluding high income)Sub-Saharan Africa (IDA & IBRD countries)SudanSurinameSwazilandSwedenSwitzerlandSyrian Arab RepublicTajikistanTanzaniaThailandTimor-LesteTogoTongaTrinidad and TobagoTunisiaTurkeyTurkmenistanTuvaluUgandaUkraineUnited Arab EmiratesUnited KingdomUnited StatesUpper middle incomeUruguayUzbekistanVanuatuVenezuela, RBVietnamWest Bank and GazaWorldYemen, Rep.ZambiaZimbabwe Timeline:
This timeline shows a graph from 1976 to 2015 of Mongolia. No data until 1975. Number of actual observations by date: 36.
Source name:
World Development Indicators
Source organization:
United Nations Educational, Scientific, and Cultural Organization (UNESCO) Institute for Statistics.
Categories, topics:
Education, Gender
Last updated:
apr 23, 2017
Indicators value changes by year
Minimum:
81.103
jan 1, 1994
Maximum:
124.232
jan 1, 2011
At the date of observation
Value
Absolute change
Change from previous value
jan 1, 1976
101.903
+101.903
0.0%
jan 1, 1977
100.475
-1.427
-1.4%
jan 1, 1979
104.114
+3.639
3.62%
jan 1, 1980
103.182
-0.932
-0.9%
jan 1, 1981
100.685
-2.497
-2.42%
jan 1, 1982
100.652
-0.033
-0.03%
jan 1, 1983
99.747
-0.905
-0.9%
jan 1, 1984
100.422
+0.675
0.68%
jan 1, 1985
99.587
-0.835
-0.83%
jan 1, 1986
99.553
-0.034
-0.03%
jan 1, 1987
99.566
+0.013
0.01%
jan 1, 1988
100.259
+0.692
0.7%
jan 1, 1992
99.728
-0.531
-0.53%
jan 1, 1993
91.863
-7.866
-7.89%
jan 1, 1994
81.103
-10.759
-11.71%
jan 1, 1995
82.078
+0.975
1.2%
jan 1, 1996
88.543
+6.465
7.88%
jan 1, 1997
94.381
+5.838
6.59%
jan 1, 1998
93.755
-0.626
-0.66%
jan 1, 1999
95.651
+1.895
2.02%
jan 1, 2000
97.349
+1.699
1.78%
jan 1, 2001
99.694
+2.345
2.41%
jan 1, 2002
102.078
+2.384
2.39%
jan 1, 2003
102.741
+0.662
0.65%
jan 1, 2004
105.527
+2.786
2.71%
jan 1, 2005
108.231
+2.704
2.56%
jan 1, 2006
97.957
-10.274
-9.49%
jan 1, 2007
100.725
+2.768
2.83%
jan 1, 2008
99.709
-1.016
-1.01%
jan 1, 2009
102.798
+3.089
3.1%
jan 1, 2010
113.505
+10.706
10.41%
jan 1, 2011
124.232
+10.728
9.45%
jan 1, 2012
120.57
-3.662
-2.95%
jan 1, 2013
115.237
-5.333
-4.42%
jan 1, 2014
107.358
-7.879
-6.84%
jan 1, 2015
100.638
-6.72
-6.26%
Ranking of countries by current statistics by years


Comments: