29
/
en
AIzaSyAYiBZKx7MnpbEhh9jyipgxe19OcubqV5w
April 1, 2024
227856
Qatar
QAT
true
2
1
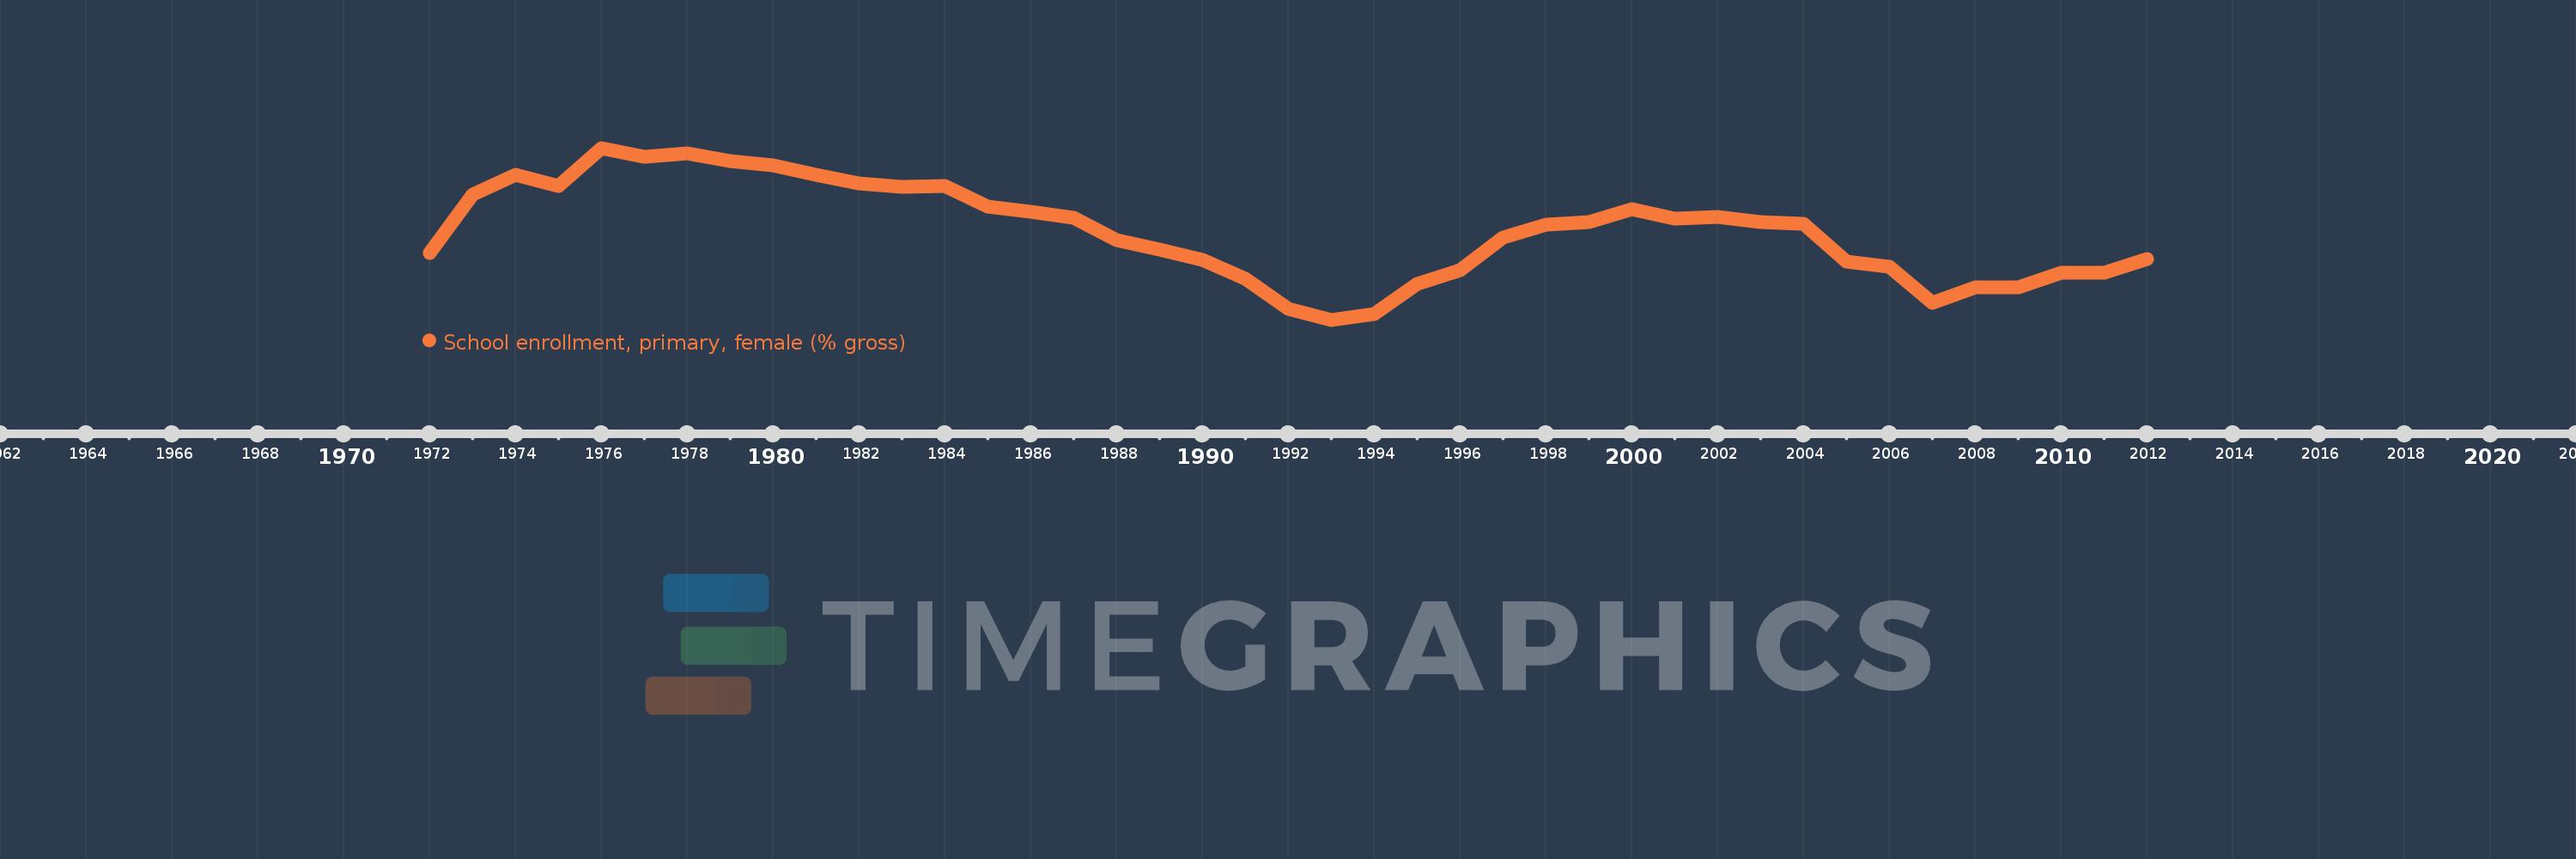
School enrollment, primary, female (% gross)
2012,2011,2010,2009,2008,2007,2006,2005,2004,2003,2002,2001,2000,1999,1998,1997,1996,1995,1994,1993,1992,1991,1990,1989,1988,1987,1986,1985,1984,1983,1982,1981,1980,1979,1978,1977,1976,1975,1974,1973,1972
This statistics in other country:
AfghanistanAlbaniaAlgeriaAndorraAngolaAntigua and BarbudaArab WorldArgentinaArmeniaArubaAustraliaAustriaAzerbaijanBahamas, TheBahrainBangladeshBarbadosBelarusBelgiumBelizeBeninBermudaBhutanBoliviaBosnia and HerzegovinaBotswanaBrazilBrunei DarussalamBulgariaBurkina FasoBurundiCabo VerdeCambodiaCameroonCanadaCaribbean small statesCentral African RepublicCentral Europe and the BalticsChadChileChinaColombiaComorosCongo, Dem. Rep.Congo, Rep.Costa RicaCote d'IvoireCroatiaCubaCuracaoCyprusCzech RepublicDenmarkDjiboutiDominicaDominican RepublicEarly-demographic dividendEast Asia & PacificEast Asia & Pacific (excluding high income)East Asia & Pacific (IDA & IBRD countries)EcuadorEgypt, Arab Rep.El SalvadorEquatorial GuineaEritreaEstoniaEthiopiaEuro areaEurope & Central AsiaEurope & Central Asia (excluding high income)Europe & Central Asia (IDA & IBRD countries)European UnionFijiFinlandFragile and conflict affected situationsFranceGabonGambia, TheGeorgiaGermanyGhanaGreeceGrenadaGuatemalaGuineaGuinea-BissauGuyanaHaitiHeavily indebted poor countries (HIPC)High incomeHondurasHong Kong SAR, ChinaHungaryIBRD onlyIcelandIDA & IBRD totalIDA blendIDA onlyIDA totalIndiaIndonesiaIran, Islamic Rep.IraqIrelandIsraelItalyJamaicaJapanJordanKazakhstanKenyaKiribatiKorea, Dem. People’s Rep.Korea, Rep.KuwaitKyrgyz RepublicLao PDRLate-demographic dividendLatin America & Caribbean Latin America & Caribbean (excluding high income)Latin America & the Caribbean (IDA & IBRD countries)LatviaLeast developed countries: UN classificationLebanonLesothoLiberiaLibyaLiechtensteinLithuaniaLow & middle incomeLow incomeLower middle incomeLuxembourgMacao SAR, ChinaMacedonia, FYRMadagascarMalawiMaldivesMaliMaltaMarshall IslandsMauritaniaMauritiusMexicoMicronesia, Fed. Sts.Middle East & North AfricaMiddle East & North Africa (excluding high income)Middle East & North Africa (IDA & IBRD countries)Middle incomeMoldovaMongoliaMontenegroMoroccoMozambiqueMyanmarNamibiaNauruNepalNetherlandsNew ZealandNicaraguaNigerNigeriaNorth AmericaNorwayOECD membersOmanOther small statesPacific island small statesPakistanPalauPanamaPapua New GuineaParaguayPeruPhilippinesPolandPortugalPost-demographic dividendPre-demographic dividendPuerto RicoQatarRomaniaRussian FederationRwandaSamoaSan MarinoSao Tome and PrincipeSaudi ArabiaSenegalSerbiaSeychellesSierra LeoneSlovak RepublicSloveniaSmall statesSolomon IslandsSomaliaSouth AfricaSouth AsiaSouth Asia (IDA & IBRD)South SudanSpainSri LankaSt. Kitts and NevisSt. LuciaSt. Vincent and the GrenadinesSub-Saharan Africa Sub-Saharan Africa (excluding high income)Sub-Saharan Africa (IDA & IBRD countries)SudanSurinameSwazilandSwedenSwitzerlandSyrian Arab RepublicTajikistanTanzaniaThailandTimor-LesteTogoTongaTrinidad and TobagoTunisiaTurkeyTurkmenistanTuvaluUgandaUkraineUnited Arab EmiratesUnited KingdomUnited StatesUpper middle incomeUruguayUzbekistanVanuatuVenezuela, RBVietnamWest Bank and GazaWorldYemen, Rep.ZambiaZimbabwe Timeline:
This timeline shows a graph from 1972 to 2012 of Qatar. No data until 1971. Number of actual observations by date: 41.
Source name:
World Development Indicators
Source organization:
United Nations Educational, Scientific, and Cultural Organization (UNESCO) Institute for Statistics.
Categories, topics:
Education, Gender
Last updated:
apr 23, 2017
Indicators value changes by year
Minimum:
86.008
jan 1, 1993
Maximum:
122.829
jan 1, 1976
At the date of observation
Value
Absolute change
Change from previous value
jan 1, 1972
100.223
+100.223
0.0%
jan 1, 1973
112.901
+12.677
12.65%
jan 1, 1974
117.096
+4.196
3.72%
jan 1, 1975
114.723
-2.373
-2.03%
jan 1, 1976
122.829
+8.106
7.07%
jan 1, 1977
120.951
-1.878
-1.53%
jan 1, 1978
121.606
+0.656
0.54%
jan 1, 1979
120.077
-1.529
-1.26%
jan 1, 1980
119.011
-1.066
-0.89%
jan 1, 1981
117.05
-1.96
-1.65%
jan 1, 1982
115.241
-1.809
-1.55%
jan 1, 1983
114.43
-0.812
-0.7%
jan 1, 1984
114.596
+0.166
0.15%
jan 1, 1985
110.33
-4.266
-3.72%
jan 1, 1986
109.232
-1.098
-1.0%
jan 1, 1987
107.922
-1.31
-1.2%
jan 1, 1988
103.12
-4.801
-4.45%
jan 1, 1989
101.067
-2.053
-1.99%
jan 1, 1990
98.837
-2.23
-2.21%
jan 1, 1991
94.81
-4.027
-4.07%
jan 1, 1992
88.322
-6.488
-6.84%
jan 1, 1993
86.008
-2.314
-2.62%
jan 1, 1994
87.292
+1.284
1.49%
jan 1, 1995
93.606
+6.313
7.23%
jan 1, 1996
96.697
+3.091
3.3%
jan 1, 1997
103.62
+6.923
7.16%
jan 1, 1998
106.468
+2.848
2.75%
jan 1, 1999
106.925
+0.457
0.43%
jan 1, 2000
109.777
+2.852
2.67%
jan 1, 2001
107.754
-2.023
-1.84%
jan 1, 2002
108.052
+0.298
0.28%
jan 1, 2003
106.899
-1.153
-1.07%
jan 1, 2004
106.57
-0.329
-0.31%
jan 1, 2005
98.462
-8.108
-7.61%
jan 1, 2006
97.324
-1.138
-1.16%
jan 1, 2007
89.602
-7.722
-7.93%
jan 1, 2008
92.862
+3.26
3.64%
jan 1, 2009
92.97
+0.108
0.12%
jan 1, 2010
95.99
+3.02
3.25%
jan 1, 2011
96.112
+0.122
0.13%
jan 1, 2012
99.003
+2.892
3.01%
Ranking of countries by current statistics by years


Comments: