29
/
en
AIzaSyAYiBZKx7MnpbEhh9jyipgxe19OcubqV5w
April 1, 2024
31113
Europe & Central Asia
ECS
false
2
1
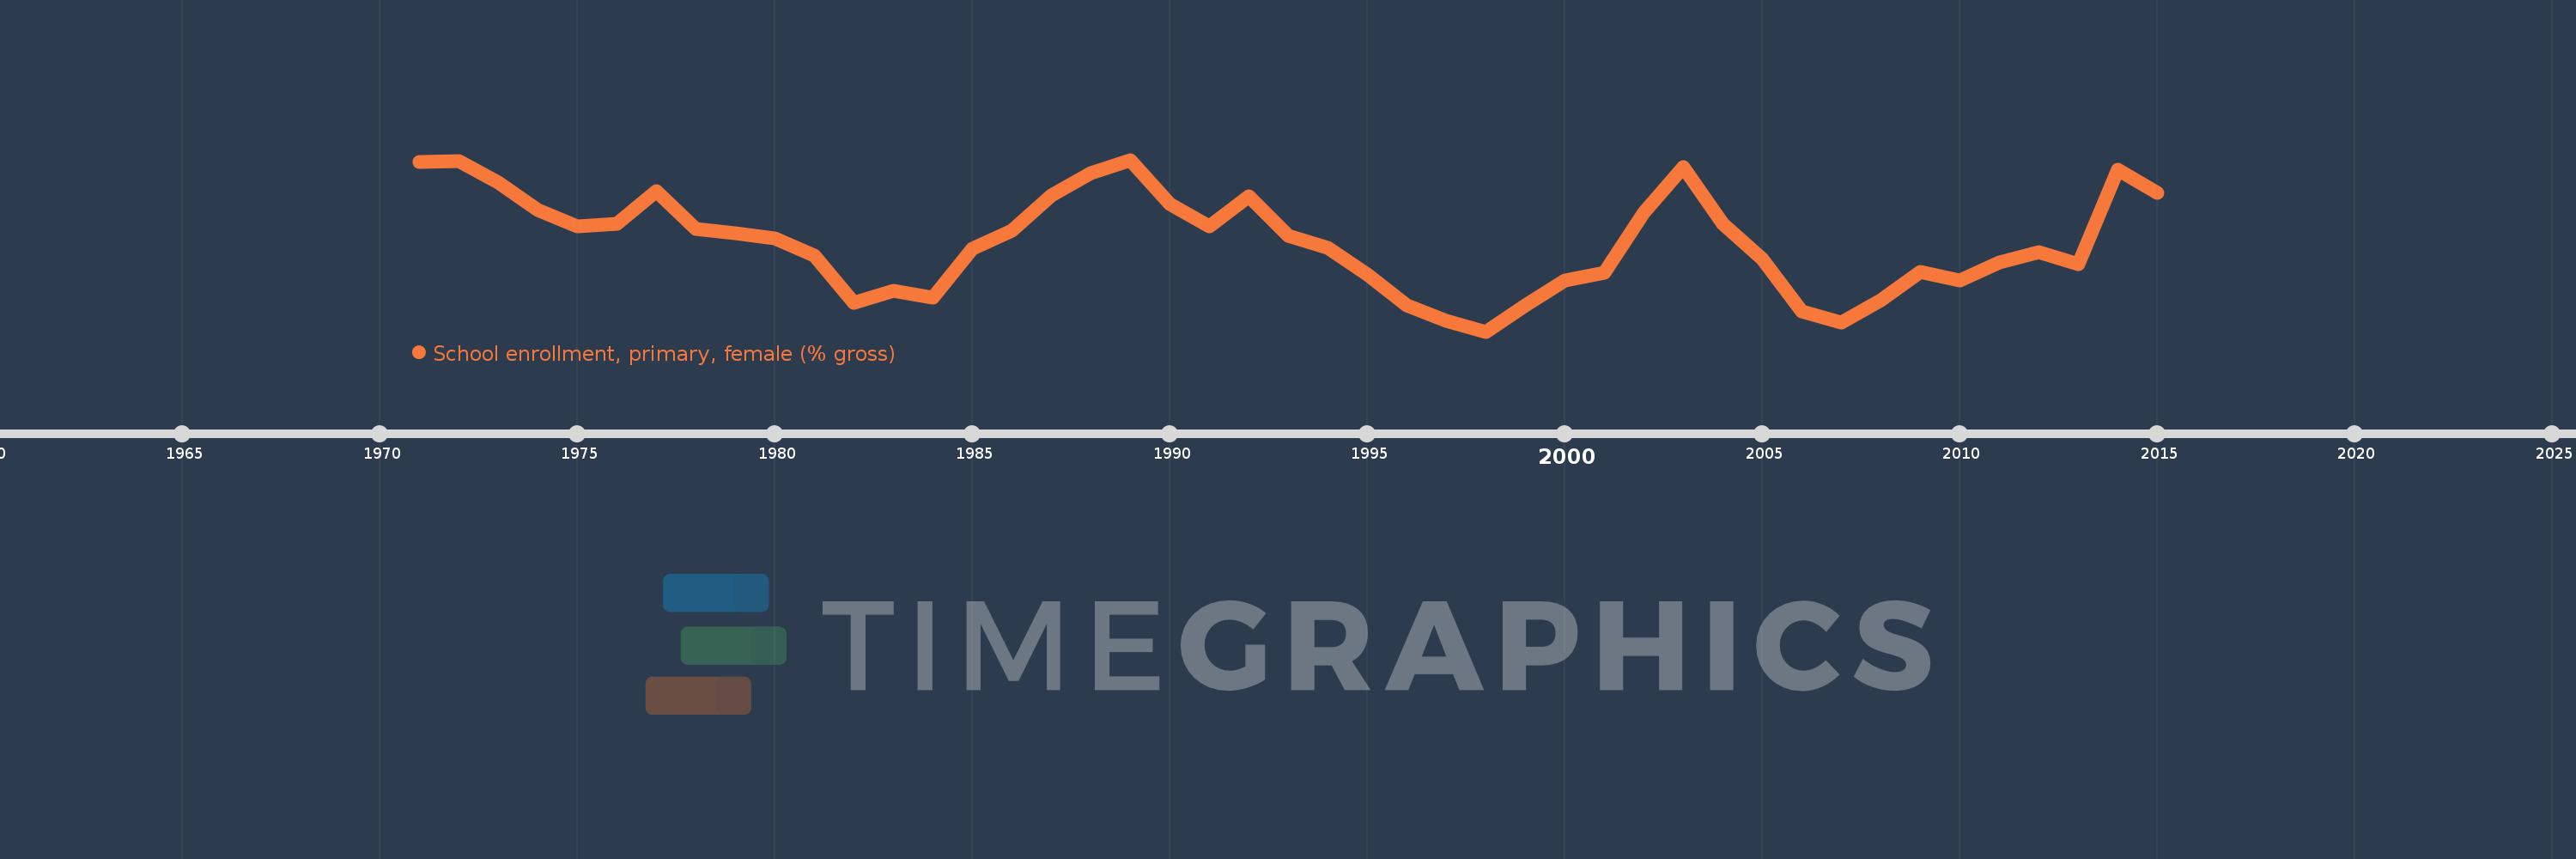
School enrollment, primary, female (% gross)
2015,2014,2013,2012,2011,2010,2009,2008,2007,2006,2005,2004,2003,2002,2001,2000,1999,1998,1997,1996,1995,1994,1993,1992,1991,1990,1989,1988,1987,1986,1985,1984,1983,1982,1981,1980,1979,1978,1977,1976,1975,1974,1973,1972,1971
This statistics in other country:
AfghanistanAlbaniaAlgeriaAndorraAngolaAntigua and BarbudaArab WorldArgentinaArmeniaArubaAustraliaAustriaAzerbaijanBahamas, TheBahrainBangladeshBarbadosBelarusBelgiumBelizeBeninBermudaBhutanBoliviaBosnia and HerzegovinaBotswanaBrazilBrunei DarussalamBulgariaBurkina FasoBurundiCabo VerdeCambodiaCameroonCanadaCaribbean small statesCentral African RepublicCentral Europe and the BalticsChadChileChinaColombiaComorosCongo, Dem. Rep.Congo, Rep.Costa RicaCote d'IvoireCroatiaCubaCuracaoCyprusCzech RepublicDenmarkDjiboutiDominicaDominican RepublicEarly-demographic dividendEast Asia & PacificEast Asia & Pacific (excluding high income)East Asia & Pacific (IDA & IBRD countries)EcuadorEgypt, Arab Rep.El SalvadorEquatorial GuineaEritreaEstoniaEthiopiaEuro areaEurope & Central AsiaEurope & Central Asia (excluding high income)Europe & Central Asia (IDA & IBRD countries)European UnionFijiFinlandFragile and conflict affected situationsFranceGabonGambia, TheGeorgiaGermanyGhanaGreeceGrenadaGuatemalaGuineaGuinea-BissauGuyanaHaitiHeavily indebted poor countries (HIPC)High incomeHondurasHong Kong SAR, ChinaHungaryIBRD onlyIcelandIDA & IBRD totalIDA blendIDA onlyIDA totalIndiaIndonesiaIran, Islamic Rep.IraqIrelandIsraelItalyJamaicaJapanJordanKazakhstanKenyaKiribatiKorea, Dem. People’s Rep.Korea, Rep.KuwaitKyrgyz RepublicLao PDRLate-demographic dividendLatin America & Caribbean Latin America & Caribbean (excluding high income)Latin America & the Caribbean (IDA & IBRD countries)LatviaLeast developed countries: UN classificationLebanonLesothoLiberiaLibyaLiechtensteinLithuaniaLow & middle incomeLow incomeLower middle incomeLuxembourgMacao SAR, ChinaMacedonia, FYRMadagascarMalawiMaldivesMaliMaltaMarshall IslandsMauritaniaMauritiusMexicoMicronesia, Fed. Sts.Middle East & North AfricaMiddle East & North Africa (excluding high income)Middle East & North Africa (IDA & IBRD countries)Middle incomeMoldovaMongoliaMontenegroMoroccoMozambiqueMyanmarNamibiaNauruNepalNetherlandsNew ZealandNicaraguaNigerNigeriaNorth AmericaNorwayOECD membersOmanOther small statesPacific island small statesPakistanPalauPanamaPapua New GuineaParaguayPeruPhilippinesPolandPortugalPost-demographic dividendPre-demographic dividendPuerto RicoQatarRomaniaRussian FederationRwandaSamoaSan MarinoSao Tome and PrincipeSaudi ArabiaSenegalSerbiaSeychellesSierra LeoneSlovak RepublicSloveniaSmall statesSolomon IslandsSomaliaSouth AfricaSouth AsiaSouth Asia (IDA & IBRD)South SudanSpainSri LankaSt. Kitts and NevisSt. LuciaSt. Vincent and the GrenadinesSub-Saharan Africa Sub-Saharan Africa (excluding high income)Sub-Saharan Africa (IDA & IBRD countries)SudanSurinameSwazilandSwedenSwitzerlandSyrian Arab RepublicTajikistanTanzaniaThailandTimor-LesteTogoTongaTrinidad and TobagoTunisiaTurkeyTurkmenistanTuvaluUgandaUkraineUnited Arab EmiratesUnited KingdomUnited StatesUpper middle incomeUruguayUzbekistanVanuatuVenezuela, RBVietnamWest Bank and GazaWorldYemen, Rep.ZambiaZimbabwe Timeline:
This timeline shows a graph from 1971 to 2015 of Europe & Central Asia. No data until 1970. Number of actual observations by date: 45.
Source name:
World Development Indicators
Source organization:
United Nations Educational, Scientific, and Cultural Organization (UNESCO) Institute for Statistics.
Categories, topics:
Education, Gender
Last updated:
apr 23, 2017
Indicators value changes by year
Minimum:
101.038
jan 1, 1998
Maximum:
103.661
jan 1, 1989
At the date of observation
Value
Absolute change
Change from previous value
jan 1, 1971
103.634
+103.634
0.0%
jan 1, 1972
103.635
+0.0
0.0%
jan 1, 1973
103.308
-0.327
-0.32%
jan 1, 1974
102.898
-0.41
-0.4%
jan 1, 1975
102.642
-0.256
-0.25%
jan 1, 1976
102.68
+0.038
0.04%
jan 1, 1977
103.176
+0.496
0.48%
jan 1, 1978
102.601
-0.575
-0.56%
jan 1, 1979
102.546
-0.055
-0.05%
jan 1, 1980
102.461
-0.084
-0.08%
jan 1, 1981
102.204
-0.257
-0.25%
jan 1, 1982
101.473
-0.731
-0.72%
jan 1, 1983
101.665
+0.192
0.19%
jan 1, 1984
101.558
-0.107
-0.11%
jan 1, 1985
102.309
+0.751
0.74%
jan 1, 1986
102.582
+0.273
0.27%
jan 1, 1987
103.112
+0.531
0.52%
jan 1, 1988
103.453
+0.341
0.33%
jan 1, 1989
103.661
+0.208
0.2%
jan 1, 1990
102.98
-0.682
-0.66%
jan 1, 1991
102.649
-0.33
-0.32%
jan 1, 1992
103.104
+0.455
0.44%
jan 1, 1993
102.496
-0.608
-0.59%
jan 1, 1994
102.315
-0.182
-0.18%
jan 1, 1995
101.908
-0.407
-0.4%
jan 1, 1996
101.444
-0.464
-0.46%
jan 1, 1997
101.198
-0.246
-0.24%
jan 1, 1998
101.038
-0.16
-0.16%
jan 1, 1999
101.438
+0.4
0.4%
jan 1, 2000
101.816
+0.378
0.37%
jan 1, 2001
101.939
+0.123
0.12%
jan 1, 2002
102.856
+0.917
0.9%
jan 1, 2003
103.544
+0.688
0.67%
jan 1, 2004
102.689
-0.856
-0.83%
jan 1, 2005
102.15
-0.539
-0.52%
jan 1, 2006
101.352
-0.798
-0.78%
jan 1, 2007
101.177
-0.174
-0.17%
jan 1, 2008
101.515
+0.338
0.33%
jan 1, 2009
101.955
+0.44
0.43%
jan 1, 2010
101.824
-0.131
-0.13%
jan 1, 2011
102.098
+0.274
0.27%
jan 1, 2012
102.255
+0.156
0.15%
jan 1, 2013
102.064
-0.191
-0.19%
jan 1, 2014
103.51
+1.447
1.42%
jan 1, 2015
103.158
-0.352
-0.34%
Ranking of countries by current statistics by years


Comments: