29
/
en
AIzaSyAYiBZKx7MnpbEhh9jyipgxe19OcubqV5w
April 1, 2024
58518
South Asia (IDA & IBRD)
TSA
false
2
1
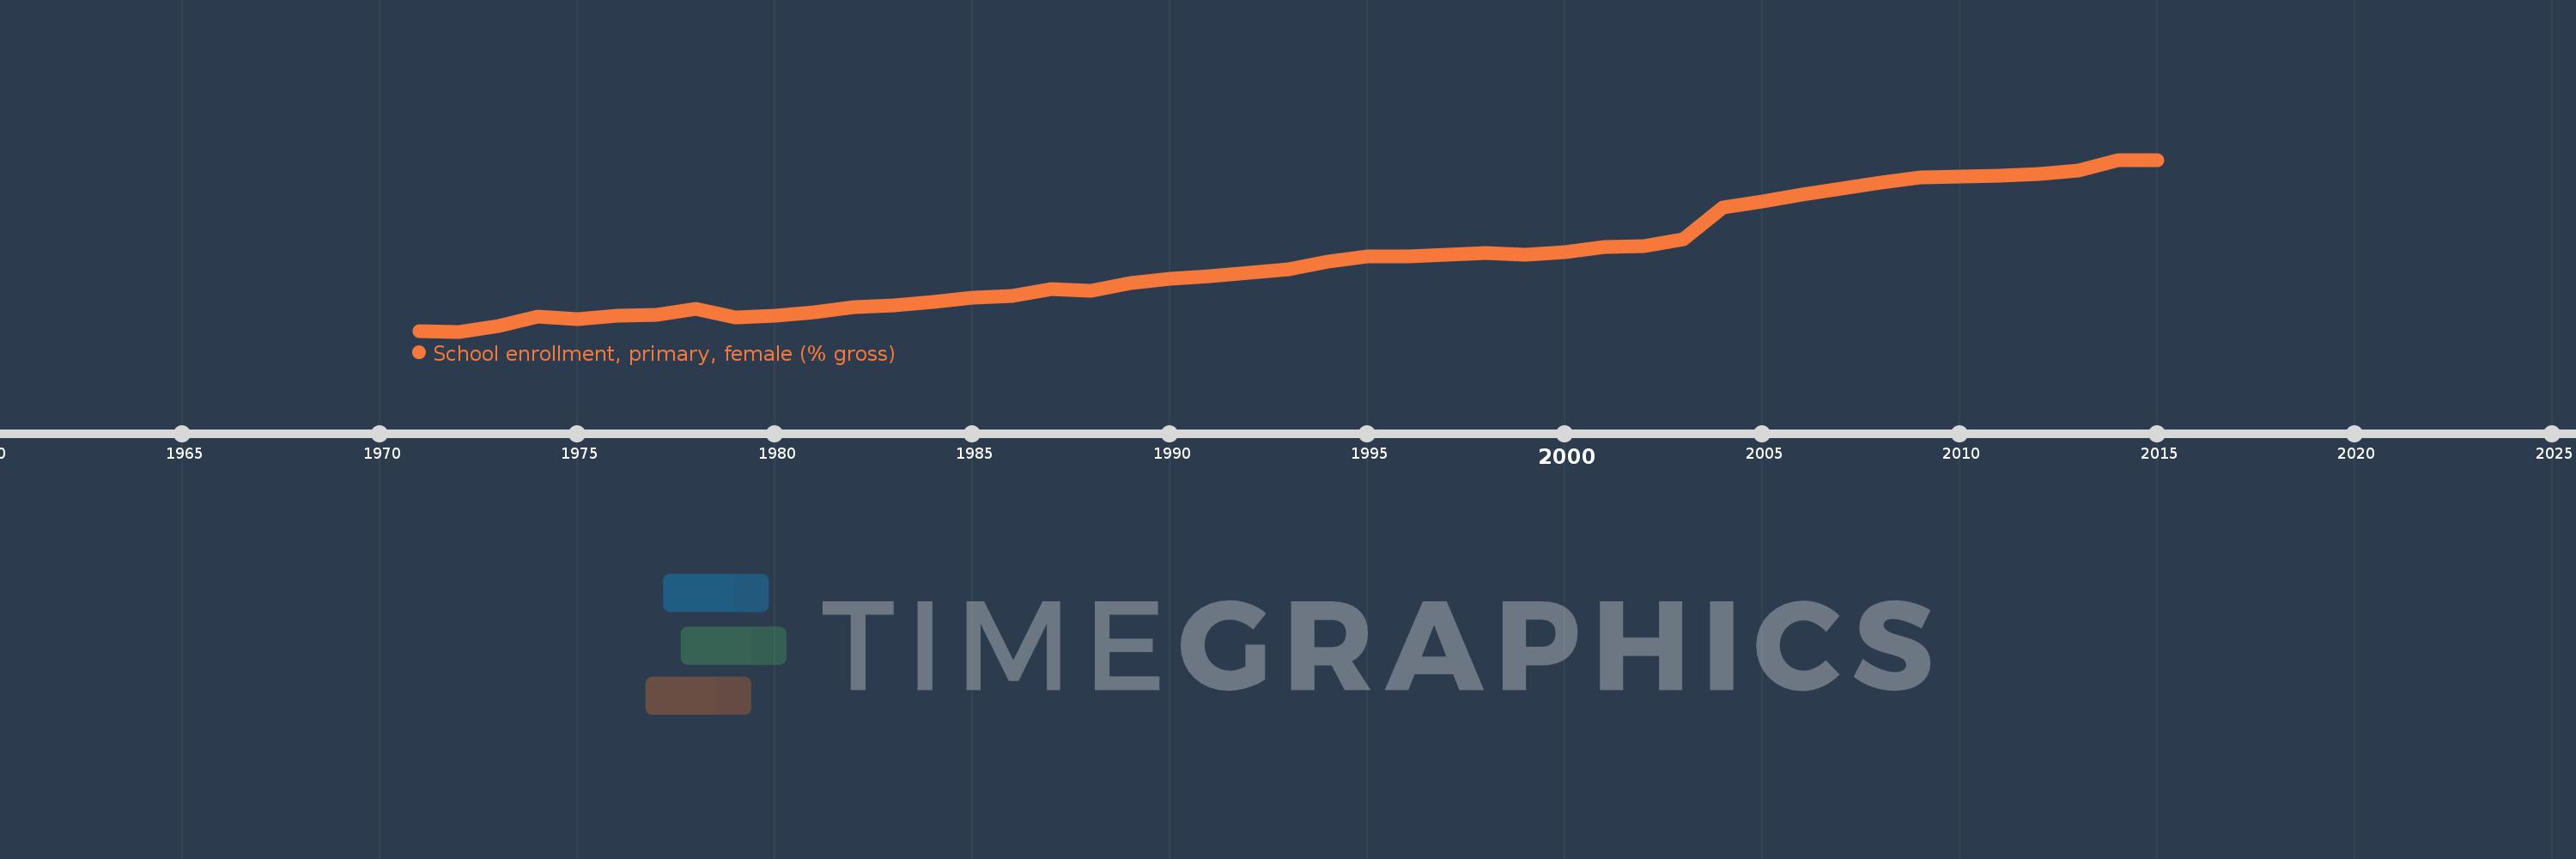
School enrollment, primary, female (% gross)
2015,2014,2013,2012,2011,2010,2009,2008,2007,2006,2005,2004,2003,2002,2001,2000,1999,1998,1997,1996,1995,1994,1993,1992,1991,1990,1989,1988,1987,1986,1985,1984,1983,1982,1981,1980,1979,1978,1977,1976,1975,1974,1973,1972,1971
This statistics in other country:
AfghanistanAlbaniaAlgeriaAndorraAngolaAntigua and BarbudaArab WorldArgentinaArmeniaArubaAustraliaAustriaAzerbaijanBahamas, TheBahrainBangladeshBarbadosBelarusBelgiumBelizeBeninBermudaBhutanBoliviaBosnia and HerzegovinaBotswanaBrazilBrunei DarussalamBulgariaBurkina FasoBurundiCabo VerdeCambodiaCameroonCanadaCaribbean small statesCentral African RepublicCentral Europe and the BalticsChadChileChinaColombiaComorosCongo, Dem. Rep.Congo, Rep.Costa RicaCote d'IvoireCroatiaCubaCuracaoCyprusCzech RepublicDenmarkDjiboutiDominicaDominican RepublicEarly-demographic dividendEast Asia & PacificEast Asia & Pacific (excluding high income)East Asia & Pacific (IDA & IBRD countries)EcuadorEgypt, Arab Rep.El SalvadorEquatorial GuineaEritreaEstoniaEthiopiaEuro areaEurope & Central AsiaEurope & Central Asia (excluding high income)Europe & Central Asia (IDA & IBRD countries)European UnionFijiFinlandFragile and conflict affected situationsFranceGabonGambia, TheGeorgiaGermanyGhanaGreeceGrenadaGuatemalaGuineaGuinea-BissauGuyanaHaitiHeavily indebted poor countries (HIPC)High incomeHondurasHong Kong SAR, ChinaHungaryIBRD onlyIcelandIDA & IBRD totalIDA blendIDA onlyIDA totalIndiaIndonesiaIran, Islamic Rep.IraqIrelandIsraelItalyJamaicaJapanJordanKazakhstanKenyaKiribatiKorea, Dem. People’s Rep.Korea, Rep.KuwaitKyrgyz RepublicLao PDRLate-demographic dividendLatin America & Caribbean Latin America & Caribbean (excluding high income)Latin America & the Caribbean (IDA & IBRD countries)LatviaLeast developed countries: UN classificationLebanonLesothoLiberiaLibyaLiechtensteinLithuaniaLow & middle incomeLow incomeLower middle incomeLuxembourgMacao SAR, ChinaMacedonia, FYRMadagascarMalawiMaldivesMaliMaltaMarshall IslandsMauritaniaMauritiusMexicoMicronesia, Fed. Sts.Middle East & North AfricaMiddle East & North Africa (excluding high income)Middle East & North Africa (IDA & IBRD countries)Middle incomeMoldovaMongoliaMontenegroMoroccoMozambiqueMyanmarNamibiaNauruNepalNetherlandsNew ZealandNicaraguaNigerNigeriaNorth AmericaNorwayOECD membersOmanOther small statesPacific island small statesPakistanPalauPanamaPapua New GuineaParaguayPeruPhilippinesPolandPortugalPost-demographic dividendPre-demographic dividendPuerto RicoQatarRomaniaRussian FederationRwandaSamoaSan MarinoSao Tome and PrincipeSaudi ArabiaSenegalSerbiaSeychellesSierra LeoneSlovak RepublicSloveniaSmall statesSolomon IslandsSomaliaSouth AfricaSouth AsiaSouth Asia (IDA & IBRD)South SudanSpainSri LankaSt. Kitts and NevisSt. LuciaSt. Vincent and the GrenadinesSub-Saharan Africa Sub-Saharan Africa (excluding high income)Sub-Saharan Africa (IDA & IBRD countries)SudanSurinameSwazilandSwedenSwitzerlandSyrian Arab RepublicTajikistanTanzaniaThailandTimor-LesteTogoTongaTrinidad and TobagoTunisiaTurkeyTurkmenistanTuvaluUgandaUkraineUnited Arab EmiratesUnited KingdomUnited StatesUpper middle incomeUruguayUzbekistanVanuatuVenezuela, RBVietnamWest Bank and GazaWorldYemen, Rep.ZambiaZimbabwe Timeline:
This timeline shows a graph from 1971 to 2015 of South Asia (IDA & IBRD). No data until 1970. Number of actual observations by date: 45.
Source name:
World Development Indicators
Source organization:
United Nations Educational, Scientific, and Cultural Organization (UNESCO) Institute for Statistics.
Categories, topics:
Education, Gender
Last updated:
apr 23, 2017
Indicators value changes by year
Minimum:
54.223
jan 1, 1972
Maximum:
112.507
jan 1, 2015
At the date of observation
Value
Absolute change
Change from previous value
jan 1, 1971
54.427
+54.427
0.0%
jan 1, 1972
54.223
-0.204
-0.38%
jan 1, 1973
56.054
+1.831
3.38%
jan 1, 1974
59.263
+3.209
5.72%
jan 1, 1975
58.537
-0.726
-1.23%
jan 1, 1976
59.566
+1.029
1.76%
jan 1, 1977
60.039
+0.473
0.79%
jan 1, 1978
61.842
+1.804
3.0%
jan 1, 1979
59.148
-2.695
-4.36%
jan 1, 1980
59.739
+0.591
1.0%
jan 1, 1981
60.881
+1.142
1.91%
jan 1, 1982
62.456
+1.575
2.59%
jan 1, 1983
63.038
+0.582
0.93%
jan 1, 1984
64.271
+1.233
1.96%
jan 1, 1985
65.832
+1.561
2.43%
jan 1, 1986
66.383
+0.551
0.84%
jan 1, 1987
68.708
+2.325
3.5%
jan 1, 1988
67.943
-0.765
-1.11%
jan 1, 1989
70.805
+2.862
4.21%
jan 1, 1990
72.193
+1.388
1.96%
jan 1, 1991
72.952
+0.759
1.05%
jan 1, 1992
74.208
+1.256
1.72%
jan 1, 1993
75.211
+1.003
1.35%
jan 1, 1994
77.919
+2.708
3.6%
jan 1, 1995
79.587
+1.667
2.14%
jan 1, 1996
79.867
+0.281
0.35%
jan 1, 1997
80.444
+0.576
0.72%
jan 1, 1998
80.775
+0.331
0.41%
jan 1, 1999
80.225
-0.55
-0.68%
jan 1, 2000
81.116
+0.89
1.11%
jan 1, 2001
82.814
+1.698
2.09%
jan 1, 2002
83.211
+0.398
0.48%
jan 1, 2003
85.611
+2.399
2.88%
jan 1, 2004
96.387
+10.776
12.59%
jan 1, 2005
98.345
+1.958
2.03%
jan 1, 2006
100.811
+2.466
2.51%
jan 1, 2007
102.615
+1.804
1.79%
jan 1, 2008
104.869
+2.254
2.2%
jan 1, 2009
106.465
+1.596
1.52%
jan 1, 2010
106.793
+0.327
0.31%
jan 1, 2011
107.22
+0.428
0.4%
jan 1, 2012
107.589
+0.369
0.34%
jan 1, 2013
108.907
+1.318
1.22%
jan 1, 2014
112.356
+3.449
3.17%
jan 1, 2015
112.507
+0.152
0.13%
Ranking of countries by current statistics by years


Comments: