29
/
en
AIzaSyAYiBZKx7MnpbEhh9jyipgxe19OcubqV5w
April 1, 2024
32169
Europe & Central Asia (excluding high income)
ECA
false
2
1
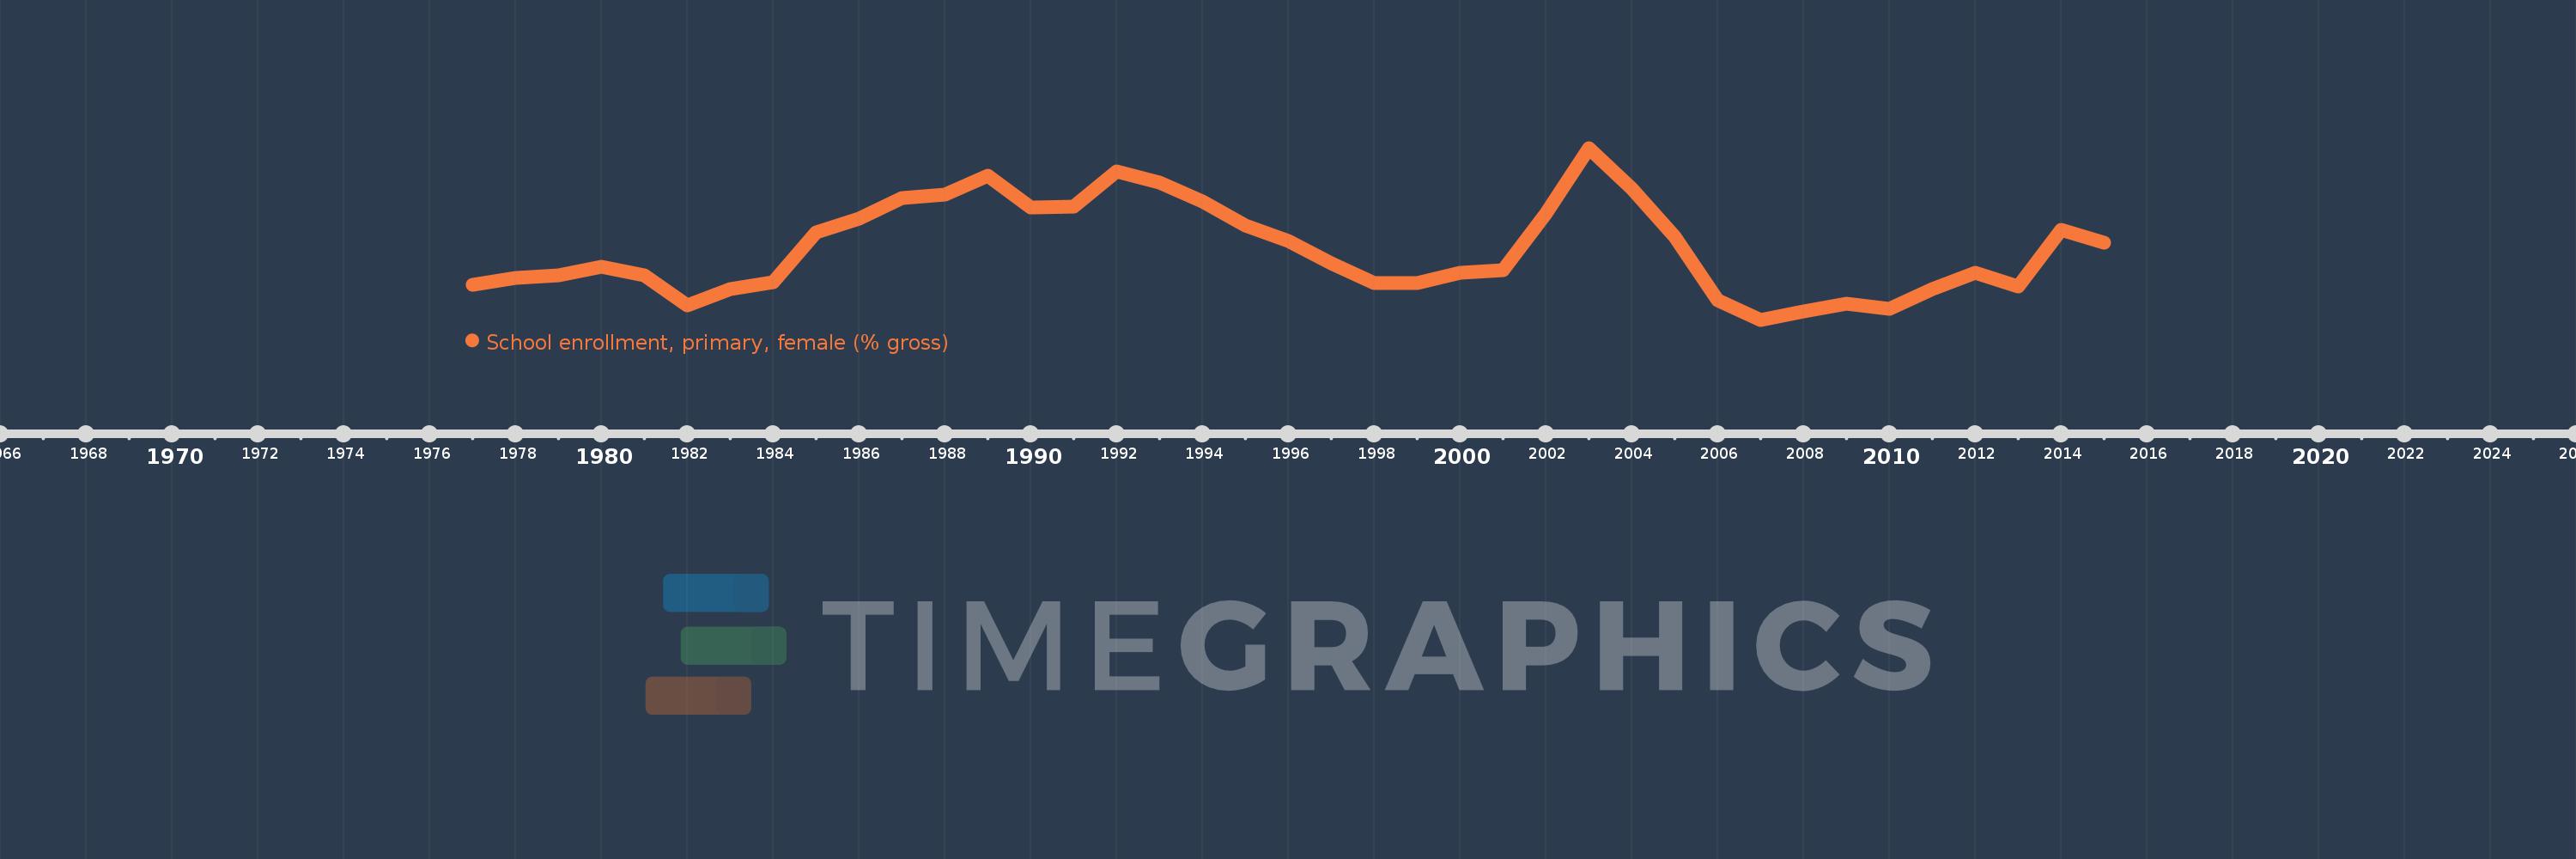
School enrollment, primary, female (% gross)
2015,2014,2013,2012,2011,2010,2009,2008,2007,2006,2005,2004,2003,2002,2001,2000,1999,1998,1997,1996,1995,1994,1993,1992,1991,1990,1989,1988,1987,1986,1985,1984,1983,1982,1981,1980,1979,1978,1977
This statistics in other country:
AfghanistanAlbaniaAlgeriaAndorraAngolaAntigua and BarbudaArab WorldArgentinaArmeniaArubaAustraliaAustriaAzerbaijanBahamas, TheBahrainBangladeshBarbadosBelarusBelgiumBelizeBeninBermudaBhutanBoliviaBosnia and HerzegovinaBotswanaBrazilBrunei DarussalamBulgariaBurkina FasoBurundiCabo VerdeCambodiaCameroonCanadaCaribbean small statesCentral African RepublicCentral Europe and the BalticsChadChileChinaColombiaComorosCongo, Dem. Rep.Congo, Rep.Costa RicaCote d'IvoireCroatiaCubaCuracaoCyprusCzech RepublicDenmarkDjiboutiDominicaDominican RepublicEarly-demographic dividendEast Asia & PacificEast Asia & Pacific (excluding high income)East Asia & Pacific (IDA & IBRD countries)EcuadorEgypt, Arab Rep.El SalvadorEquatorial GuineaEritreaEstoniaEthiopiaEuro areaEurope & Central AsiaEurope & Central Asia (excluding high income)Europe & Central Asia (IDA & IBRD countries)European UnionFijiFinlandFragile and conflict affected situationsFranceGabonGambia, TheGeorgiaGermanyGhanaGreeceGrenadaGuatemalaGuineaGuinea-BissauGuyanaHaitiHeavily indebted poor countries (HIPC)High incomeHondurasHong Kong SAR, ChinaHungaryIBRD onlyIcelandIDA & IBRD totalIDA blendIDA onlyIDA totalIndiaIndonesiaIran, Islamic Rep.IraqIrelandIsraelItalyJamaicaJapanJordanKazakhstanKenyaKiribatiKorea, Dem. People’s Rep.Korea, Rep.KuwaitKyrgyz RepublicLao PDRLate-demographic dividendLatin America & Caribbean Latin America & Caribbean (excluding high income)Latin America & the Caribbean (IDA & IBRD countries)LatviaLeast developed countries: UN classificationLebanonLesothoLiberiaLibyaLiechtensteinLithuaniaLow & middle incomeLow incomeLower middle incomeLuxembourgMacao SAR, ChinaMacedonia, FYRMadagascarMalawiMaldivesMaliMaltaMarshall IslandsMauritaniaMauritiusMexicoMicronesia, Fed. Sts.Middle East & North AfricaMiddle East & North Africa (excluding high income)Middle East & North Africa (IDA & IBRD countries)Middle incomeMoldovaMongoliaMontenegroMoroccoMozambiqueMyanmarNamibiaNauruNepalNetherlandsNew ZealandNicaraguaNigerNigeriaNorth AmericaNorwayOECD membersOmanOther small statesPacific island small statesPakistanPalauPanamaPapua New GuineaParaguayPeruPhilippinesPolandPortugalPost-demographic dividendPre-demographic dividendPuerto RicoQatarRomaniaRussian FederationRwandaSamoaSan MarinoSao Tome and PrincipeSaudi ArabiaSenegalSerbiaSeychellesSierra LeoneSlovak RepublicSloveniaSmall statesSolomon IslandsSomaliaSouth AfricaSouth AsiaSouth Asia (IDA & IBRD)South SudanSpainSri LankaSt. Kitts and NevisSt. LuciaSt. Vincent and the GrenadinesSub-Saharan Africa Sub-Saharan Africa (excluding high income)Sub-Saharan Africa (IDA & IBRD countries)SudanSurinameSwazilandSwedenSwitzerlandSyrian Arab RepublicTajikistanTanzaniaThailandTimor-LesteTogoTongaTrinidad and TobagoTunisiaTurkeyTurkmenistanTuvaluUgandaUkraineUnited Arab EmiratesUnited KingdomUnited StatesUpper middle incomeUruguayUzbekistanVanuatuVenezuela, RBVietnamWest Bank and GazaWorldYemen, Rep.ZambiaZimbabwe Timeline:
This timeline shows a graph from 1977 to 2015 of Europe & Central Asia (excluding high income). No data until 1976. Number of actual observations by date: 39.
Source name:
World Development Indicators
Source organization:
United Nations Educational, Scientific, and Cultural Organization (UNESCO) Institute for Statistics.
Categories, topics:
Education, Gender
Last updated:
apr 23, 2017
Indicators value changes by year
Minimum:
98.646
jan 1, 2007
Maximum:
105.401
jan 1, 2003
At the date of observation
Value
Absolute change
Change from previous value
jan 1, 1977
100.01
+100.01
0.0%
jan 1, 1978
100.289
+0.279
0.28%
jan 1, 1979
100.387
+0.097
0.1%
jan 1, 1980
100.735
+0.348
0.35%
jan 1, 1981
100.391
-0.343
-0.34%
jan 1, 1982
99.203
-1.189
-1.18%
jan 1, 1983
99.835
+0.633
0.64%
jan 1, 1984
100.132
+0.296
0.3%
jan 1, 1985
102.087
+1.955
1.95%
jan 1, 1986
102.623
+0.536
0.53%
jan 1, 1987
103.426
+0.803
0.78%
jan 1, 1988
103.581
+0.155
0.15%
jan 1, 1989
104.304
+0.723
0.7%
jan 1, 1990
103.067
-1.237
-1.19%
jan 1, 1991
103.089
+0.021
0.02%
jan 1, 1992
104.479
+1.39
1.35%
jan 1, 1993
104.05
-0.429
-0.41%
jan 1, 1994
103.301
-0.749
-0.72%
jan 1, 1995
102.348
-0.953
-0.92%
jan 1, 1996
101.754
-0.594
-0.58%
jan 1, 1997
100.854
-0.9
-0.88%
jan 1, 1998
100.102
-0.751
-0.75%
jan 1, 1999
100.079
-0.023
-0.02%
jan 1, 2000
100.484
+0.405
0.4%
jan 1, 2001
100.585
+0.1
0.1%
jan 1, 2002
102.84
+2.256
2.24%
jan 1, 2003
105.401
+2.56
2.49%
jan 1, 2004
103.814
-1.587
-1.51%
jan 1, 2005
101.923
-1.89
-1.82%
jan 1, 2006
99.428
-2.495
-2.45%
jan 1, 2007
98.646
-0.783
-0.79%
jan 1, 2008
98.964
+0.318
0.32%
jan 1, 2009
99.271
+0.307
0.31%
jan 1, 2010
99.071
-0.199
-0.2%
jan 1, 2011
99.866
+0.795
0.8%
jan 1, 2012
100.484
+0.618
0.62%
jan 1, 2013
99.937
-0.548
-0.54%
jan 1, 2014
102.181
+2.245
2.25%
jan 1, 2015
101.687
-0.494
-0.48%
Ranking of countries by current statistics by years


Comments: