29
/
en
AIzaSyAYiBZKx7MnpbEhh9jyipgxe19OcubqV5w
April 1, 2024
118409
Czech Republic
CZE
true
2
1
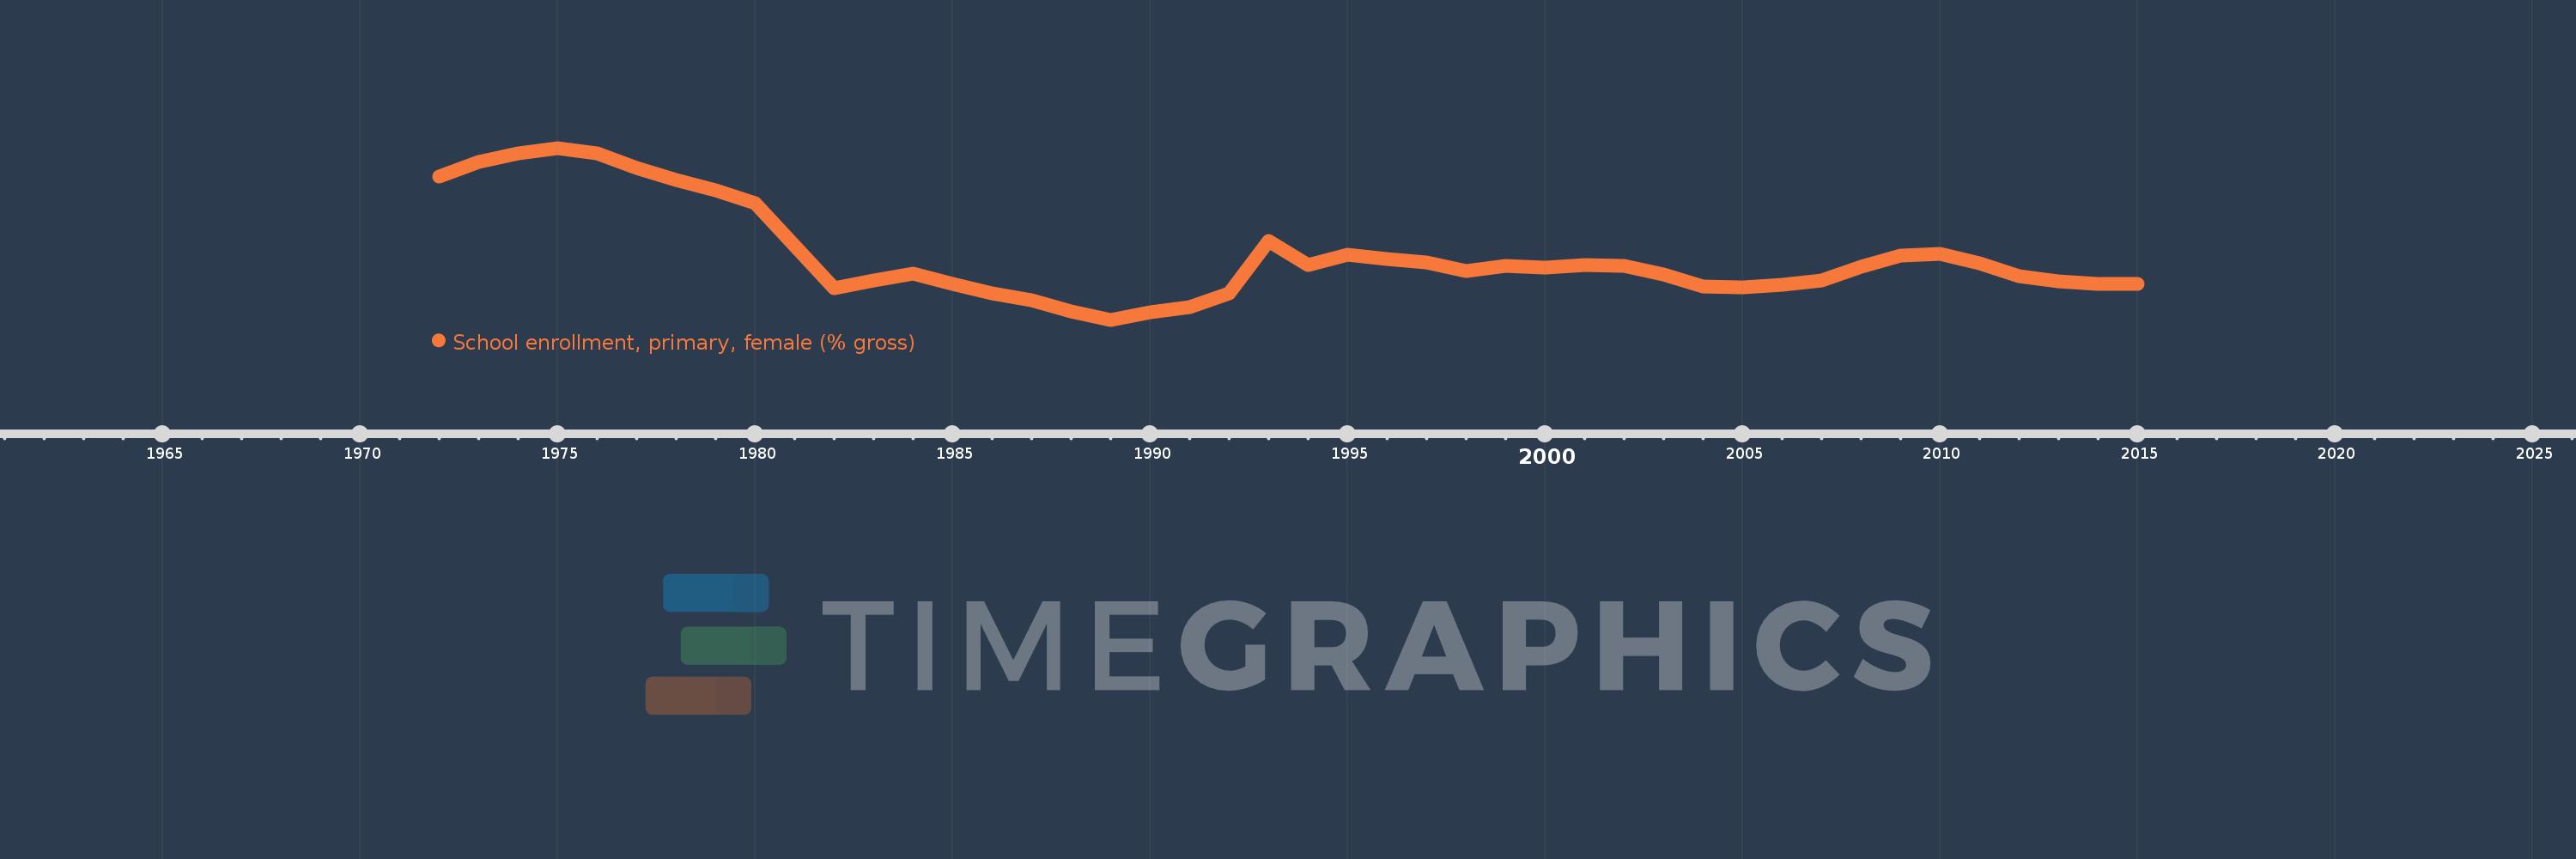
School enrollment, primary, female (% gross)
2015,2014,2013,2012,2011,2010,2009,2008,2007,2006,2005,2004,2003,2002,2001,2000,1999,1998,1997,1996,1995,1994,1993,1992,1991,1990,1989,1988,1987,1986,1985,1984,1983,1982,1980,1979,1978,1977,1976,1975,1974,1973,1972
This statistics in other country:
AfghanistanAlbaniaAlgeriaAndorraAngolaAntigua and BarbudaArab WorldArgentinaArmeniaArubaAustraliaAustriaAzerbaijanBahamas, TheBahrainBangladeshBarbadosBelarusBelgiumBelizeBeninBermudaBhutanBoliviaBosnia and HerzegovinaBotswanaBrazilBrunei DarussalamBulgariaBurkina FasoBurundiCabo VerdeCambodiaCameroonCanadaCaribbean small statesCentral African RepublicCentral Europe and the BalticsChadChileChinaColombiaComorosCongo, Dem. Rep.Congo, Rep.Costa RicaCote d'IvoireCroatiaCubaCuracaoCyprusCzech RepublicDenmarkDjiboutiDominicaDominican RepublicEarly-demographic dividendEast Asia & PacificEast Asia & Pacific (excluding high income)East Asia & Pacific (IDA & IBRD countries)EcuadorEgypt, Arab Rep.El SalvadorEquatorial GuineaEritreaEstoniaEthiopiaEuro areaEurope & Central AsiaEurope & Central Asia (excluding high income)Europe & Central Asia (IDA & IBRD countries)European UnionFijiFinlandFragile and conflict affected situationsFranceGabonGambia, TheGeorgiaGermanyGhanaGreeceGrenadaGuatemalaGuineaGuinea-BissauGuyanaHaitiHeavily indebted poor countries (HIPC)High incomeHondurasHong Kong SAR, ChinaHungaryIBRD onlyIcelandIDA & IBRD totalIDA blendIDA onlyIDA totalIndiaIndonesiaIran, Islamic Rep.IraqIrelandIsraelItalyJamaicaJapanJordanKazakhstanKenyaKiribatiKorea, Dem. People’s Rep.Korea, Rep.KuwaitKyrgyz RepublicLao PDRLate-demographic dividendLatin America & Caribbean Latin America & Caribbean (excluding high income)Latin America & the Caribbean (IDA & IBRD countries)LatviaLeast developed countries: UN classificationLebanonLesothoLiberiaLibyaLiechtensteinLithuaniaLow & middle incomeLow incomeLower middle incomeLuxembourgMacao SAR, ChinaMacedonia, FYRMadagascarMalawiMaldivesMaliMaltaMarshall IslandsMauritaniaMauritiusMexicoMicronesia, Fed. Sts.Middle East & North AfricaMiddle East & North Africa (excluding high income)Middle East & North Africa (IDA & IBRD countries)Middle incomeMoldovaMongoliaMontenegroMoroccoMozambiqueMyanmarNamibiaNauruNepalNetherlandsNew ZealandNicaraguaNigerNigeriaNorth AmericaNorwayOECD membersOmanOther small statesPacific island small statesPakistanPalauPanamaPapua New GuineaParaguayPeruPhilippinesPolandPortugalPost-demographic dividendPre-demographic dividendPuerto RicoQatarRomaniaRussian FederationRwandaSamoaSan MarinoSao Tome and PrincipeSaudi ArabiaSenegalSerbiaSeychellesSierra LeoneSlovak RepublicSloveniaSmall statesSolomon IslandsSomaliaSouth AfricaSouth AsiaSouth Asia (IDA & IBRD)South SudanSpainSri LankaSt. Kitts and NevisSt. LuciaSt. Vincent and the GrenadinesSub-Saharan Africa Sub-Saharan Africa (excluding high income)Sub-Saharan Africa (IDA & IBRD countries)SudanSurinameSwazilandSwedenSwitzerlandSyrian Arab RepublicTajikistanTanzaniaThailandTimor-LesteTogoTongaTrinidad and TobagoTunisiaTurkeyTurkmenistanTuvaluUgandaUkraineUnited Arab EmiratesUnited KingdomUnited StatesUpper middle incomeUruguayUzbekistanVanuatuVenezuela, RBVietnamWest Bank and GazaWorldYemen, Rep.ZambiaZimbabwe Timeline:
This timeline shows a graph from 1972 to 2015 of Czech Republic. No data until 1971. Number of actual observations by date: 43.
Source name:
World Development Indicators
Source organization:
United Nations Educational, Scientific, and Cultural Organization (UNESCO) Institute for Statistics.
Categories, topics:
Education, Gender
Last updated:
apr 23, 2017
Indicators value changes by year
Minimum:
90.632
jan 1, 1989
Maximum:
130.526
jan 1, 1975
At the date of observation
Value
Absolute change
Change from previous value
jan 1, 1972
123.854
+123.854
0.0%
jan 1, 1973
127.189
+3.335
2.69%
jan 1, 1974
129.251
+2.062
1.62%
jan 1, 1975
130.526
+1.275
0.99%
jan 1, 1976
129.355
-1.17
-0.9%
jan 1, 1977
125.868
-3.487
-2.7%
jan 1, 1978
122.99
-2.879
-2.29%
jan 1, 1979
120.625
-2.364
-1.92%
jan 1, 1980
117.672
-2.954
-2.45%
jan 1, 1982
98.014
-19.658
-16.71%
jan 1, 1983
99.756
+1.742
1.78%
jan 1, 1984
101.256
+1.5
1.5%
jan 1, 1985
98.88
-2.375
-2.35%
jan 1, 1986
96.676
-2.204
-2.23%
jan 1, 1987
95.189
-1.487
-1.54%
jan 1, 1988
92.647
-2.542
-2.67%
jan 1, 1989
90.632
-2.015
-2.18%
jan 1, 1990
92.318
+1.686
1.86%
jan 1, 1991
93.568
+1.25
1.35%
jan 1, 1992
96.811
+3.243
3.47%
jan 1, 1993
108.854
+12.043
12.44%
jan 1, 1994
103.386
-5.468
-5.02%
jan 1, 1995
105.816
+2.43
2.35%
jan 1, 1996
104.653
-1.163
-1.1%
jan 1, 1997
103.935
-0.718
-0.69%
jan 1, 1998
101.883
-2.052
-1.97%
jan 1, 1999
103.109
+1.226
1.2%
jan 1, 2000
102.8
-0.309
-0.3%
jan 1, 2001
103.247
+0.447
0.43%
jan 1, 2002
103.093
-0.155
-0.15%
jan 1, 2003
101.049
-2.044
-1.98%
jan 1, 2004
98.384
-2.665
-2.64%
jan 1, 2005
98.067
-0.317
-0.32%
jan 1, 2006
98.669
+0.602
0.61%
jan 1, 2007
99.773
+1.104
1.12%
jan 1, 2008
102.964
+3.191
3.2%
jan 1, 2009
105.527
+2.563
2.49%
jan 1, 2010
105.918
+0.392
0.37%
jan 1, 2011
103.779
-2.14
-2.02%
jan 1, 2012
100.66
-3.119
-3.01%
jan 1, 2013
99.53
-1.13
-1.12%
jan 1, 2014
98.982
-0.548
-0.55%
jan 1, 2015
98.878
-0.104
-0.11%
Ranking of countries by current statistics by years


Comments: