29
/
en
AIzaSyAYiBZKx7MnpbEhh9jyipgxe19OcubqV5w
April 1, 2024
61421
Upper middle income
UMC
false
2
1
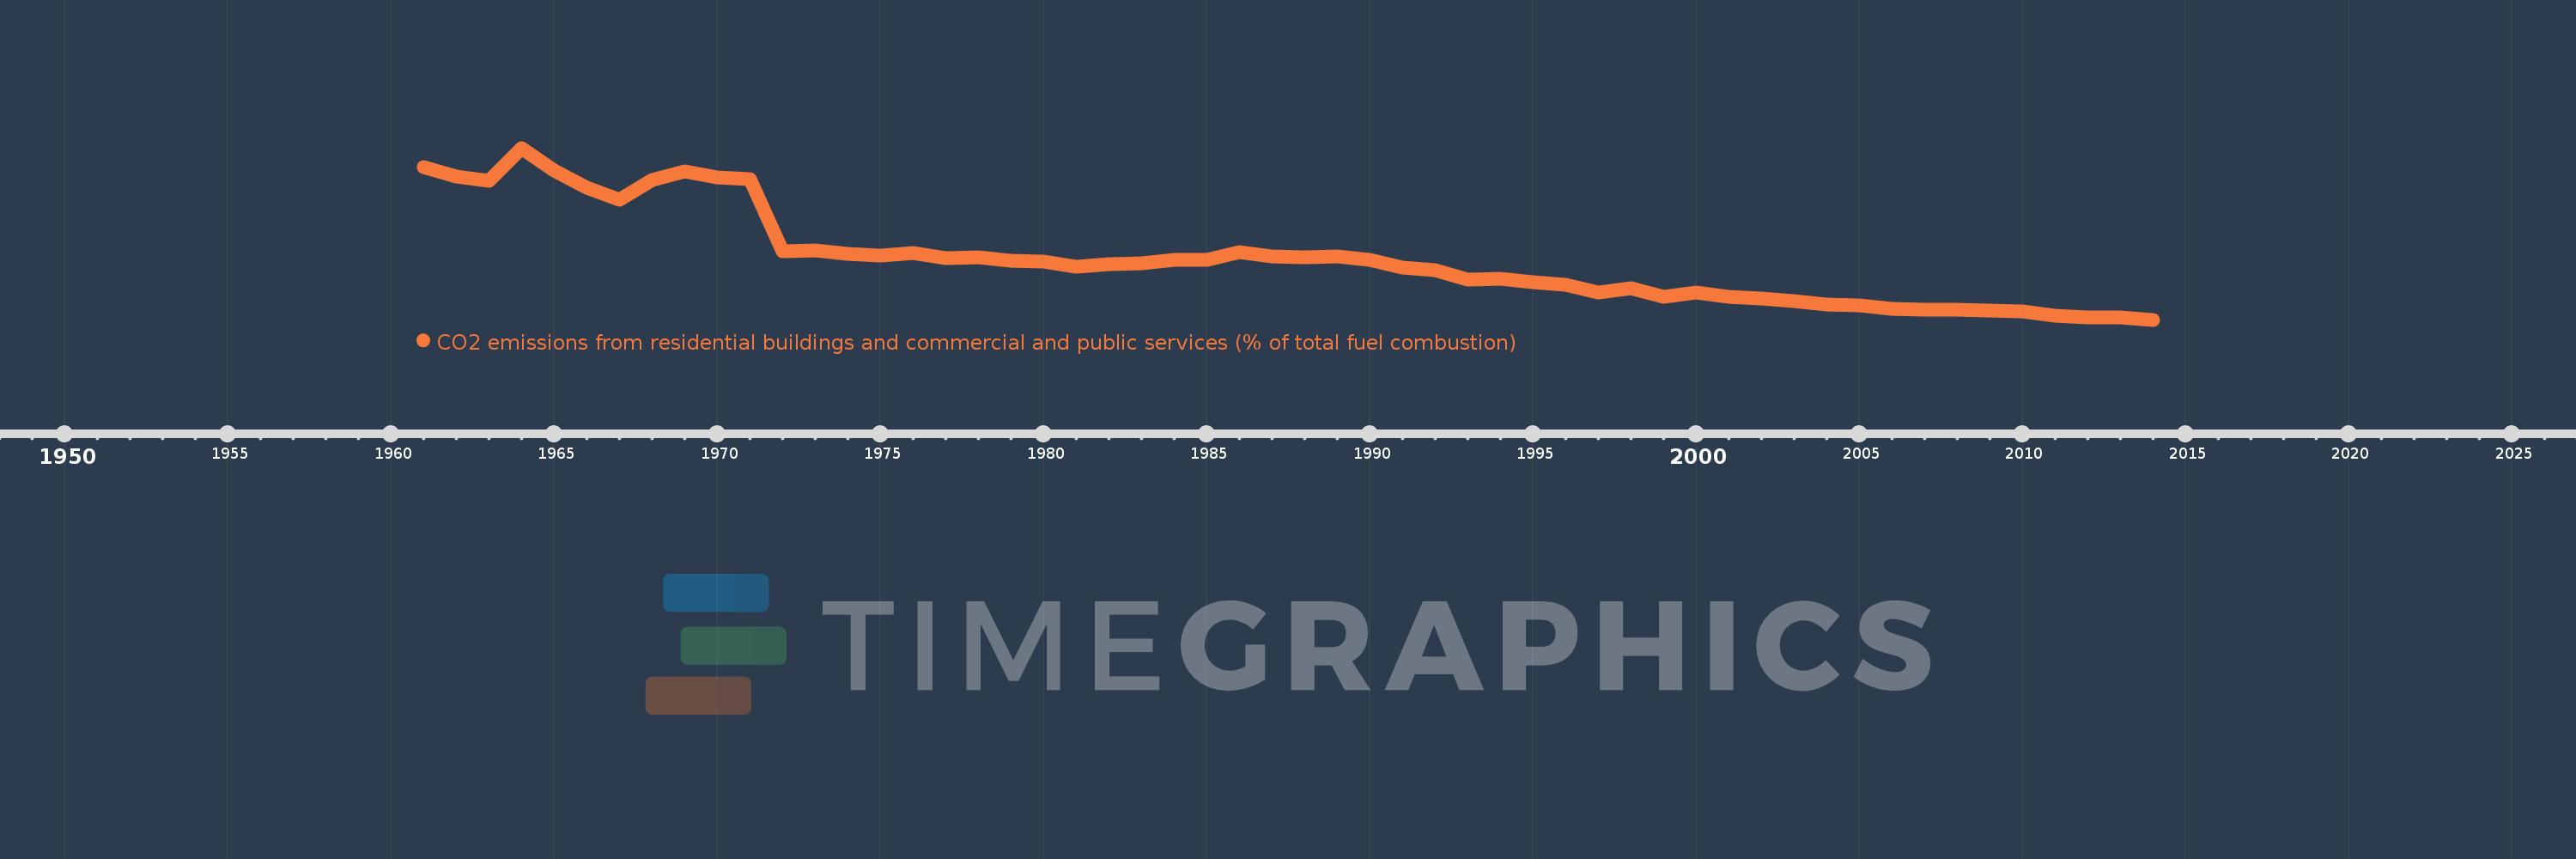
CO2 emissions from residential buildings and commercial and public services (% of total fuel combustion)
2014,2013,2012,2011,2010,2009,2008,2007,2006,2005,2004,2003,2002,2001,2000,1999,1998,1997,1996,1995,1994,1993,1992,1991,1990,1989,1988,1987,1986,1985,1984,1983,1982,1981,1980,1979,1978,1977,1976,1975,1974,1973,1972,1971,1970,1969,1968,1967,1966,1965,1964,1963,1962,1961
This statistics in other country:
AlbaniaAlgeriaAngolaArab WorldArgentinaArmeniaAustraliaAustriaAzerbaijanBahrainBangladeshBelarusBelgiumBeninBoliviaBosnia and HerzegovinaBotswanaBrazilBrunei DarussalamBulgariaCambodiaCameroonCanadaCaribbean small statesCentral Europe and the BalticsChileChinaColombiaCongo, Dem. Rep.Congo, Rep.Costa RicaCote d'IvoireCroatiaCubaCuracaoCyprusCzech RepublicDenmarkDominican RepublicEarly-demographic dividendEast Asia & PacificEast Asia & Pacific (excluding high income)East Asia & Pacific (IDA & IBRD countries)EcuadorEgypt, Arab Rep.El SalvadorEritreaEstoniaEthiopiaEuro areaEurope & Central AsiaEurope & Central Asia (excluding high income)Europe & Central Asia (IDA & IBRD countries)European UnionFinlandFragile and conflict affected situationsFranceGabonGeorgiaGermanyGhanaGibraltarGreeceGuatemalaHaitiHeavily indebted poor countries (HIPC)High incomeHondurasHong Kong SAR, ChinaHungaryIBRD onlyIcelandIDA & IBRD totalIDA blendIDA onlyIDA totalIndiaIndonesiaIran, Islamic Rep.IraqIrelandIsraelItalyJamaicaJapanJordanKazakhstanKenyaKorea, Dem. People’s Rep.Korea, Rep.KosovoKuwaitKyrgyz RepublicLate-demographic dividendLatin America & Caribbean Latin America & Caribbean (excluding high income)Latin America & the Caribbean (IDA & IBRD countries)LatviaLeast developed countries: UN classificationLebanonLibyaLithuaniaLow & middle incomeLow incomeLower middle incomeLuxembourgMacedonia, FYRMalaysiaMaltaMauritiusMexicoMiddle East & North AfricaMiddle East & North Africa (excluding high income)Middle East & North Africa (IDA & IBRD countries)Middle incomeMoldovaMongoliaMontenegroMoroccoMozambiqueMyanmarNamibiaNepalNetherlandsNew ZealandNicaraguaNigerNigeriaNorth AmericaNorwayOECD membersOmanOther small statesPakistanPanamaParaguayPeruPhilippinesPolandPortugalPost-demographic dividendPre-demographic dividendQatarRomaniaRussian FederationSaudi ArabiaSenegalSerbiaSingaporeSlovak RepublicSloveniaSmall statesSouth AfricaSouth AsiaSouth Asia (IDA & IBRD)South SudanSpainSri LankaSub-Saharan Africa Sub-Saharan Africa (excluding high income)Sub-Saharan Africa (IDA & IBRD countries)SudanSwedenSwitzerlandSyrian Arab RepublicTajikistanTanzaniaThailandTogoTrinidad and TobagoTunisiaTurkeyTurkmenistanUkraineUnited Arab EmiratesUnited KingdomUnited StatesUpper middle incomeUruguayUzbekistanVenezuela, RBVietnamWorldYemen, Rep.ZambiaZimbabwe Timeline:
This timeline shows a graph from 1961 to 2014 of Upper middle income. No data until 1960. Number of actual observations by date: 54.
Source name:
World Development Indicators
Source organization:
IEA Statistics © OECD/IEA 2014 (http://www.iea.org/stats/index.asp), subject to https://www.iea.org/t&c/termsandconditions/
Categories, topics:
Environment
Last updated:
apr 23, 2017
Indicators value changes by year
Maximum:
27.058
jan 1, 1964
At the date of observation
Value
Absolute change
Change from previous value
jan 1, 1961
24.806
+24.806
0.0%
jan 1, 1962
23.705
-1.101
-4.44%
jan 1, 1963
23.206
-0.499
-2.11%
jan 1, 1964
27.058
+3.852
16.6%
jan 1, 1965
24.415
-2.642
-9.77%
jan 1, 1966
22.396
-2.019
-8.27%
jan 1, 1967
20.954
-1.442
-6.44%
jan 1, 1968
23.225
+2.271
10.84%
jan 1, 1969
24.24
+1.014
4.37%
jan 1, 1970
23.603
-0.636
-2.63%
jan 1, 1971
23.378
-0.225
-0.95%
jan 1, 1972
14.82
-8.558
-36.61%
jan 1, 1973
14.931
+0.111
0.75%
jan 1, 1974
14.511
-0.42
-2.81%
jan 1, 1975
14.321
-0.19
-1.31%
jan 1, 1976
14.597
+0.276
1.93%
jan 1, 1977
13.985
-0.611
-4.19%
jan 1, 1978
14.12
+0.134
0.96%
jan 1, 1979
13.682
-0.437
-3.1%
jan 1, 1980
13.593
-0.089
-0.65%
jan 1, 1981
12.999
-0.595
-4.37%
jan 1, 1982
13.345
+0.346
2.66%
jan 1, 1983
13.438
+0.093
0.69%
jan 1, 1984
13.772
+0.334
2.49%
jan 1, 1985
13.827
+0.055
0.4%
jan 1, 1986
14.689
+0.861
6.23%
jan 1, 1987
14.198
-0.491
-3.34%
jan 1, 1988
14.114
-0.084
-0.59%
jan 1, 1989
14.238
+0.124
0.88%
jan 1, 1990
13.806
-0.432
-3.03%
jan 1, 1991
12.945
-0.861
-6.24%
jan 1, 1992
12.58
-0.365
-2.82%
jan 1, 1993
11.478
-1.102
-8.76%
jan 1, 1994
11.614
+0.136
1.18%
jan 1, 1995
11.161
-0.453
-3.9%
jan 1, 1996
10.884
-0.277
-2.48%
jan 1, 1997
9.971
-0.913
-8.39%
jan 1, 1998
10.511
+0.54
5.42%
jan 1, 1999
9.464
-1.047
-9.96%
jan 1, 2000
9.966
+0.502
5.31%
jan 1, 2001
9.459
-0.507
-5.09%
jan 1, 2002
9.282
-0.177
-1.87%
jan 1, 2003
8.97
-0.312
-3.36%
jan 1, 2004
8.575
-0.395
-4.4%
jan 1, 2005
8.396
-0.179
-2.09%
jan 1, 2006
8.067
-0.329
-3.92%
jan 1, 2007
7.92
-0.148
-1.83%
jan 1, 2008
7.962
+0.043
0.54%
jan 1, 2009
7.873
-0.089
-1.12%
jan 1, 2010
7.689
-0.184
-2.34%
jan 1, 2011
7.228
-0.461
-6.0%
jan 1, 2012
6.979
-0.25
-3.45%
jan 1, 2013
6.962
-0.017
-0.24%
jan 1, 2014
6.736
-0.226
-3.25%
Ranking of countries by current statistics by years


Comments: