29
/
en
AIzaSyAYiBZKx7MnpbEhh9jyipgxe19OcubqV5w
April 1, 2024
154348
India
IND
true
2
1
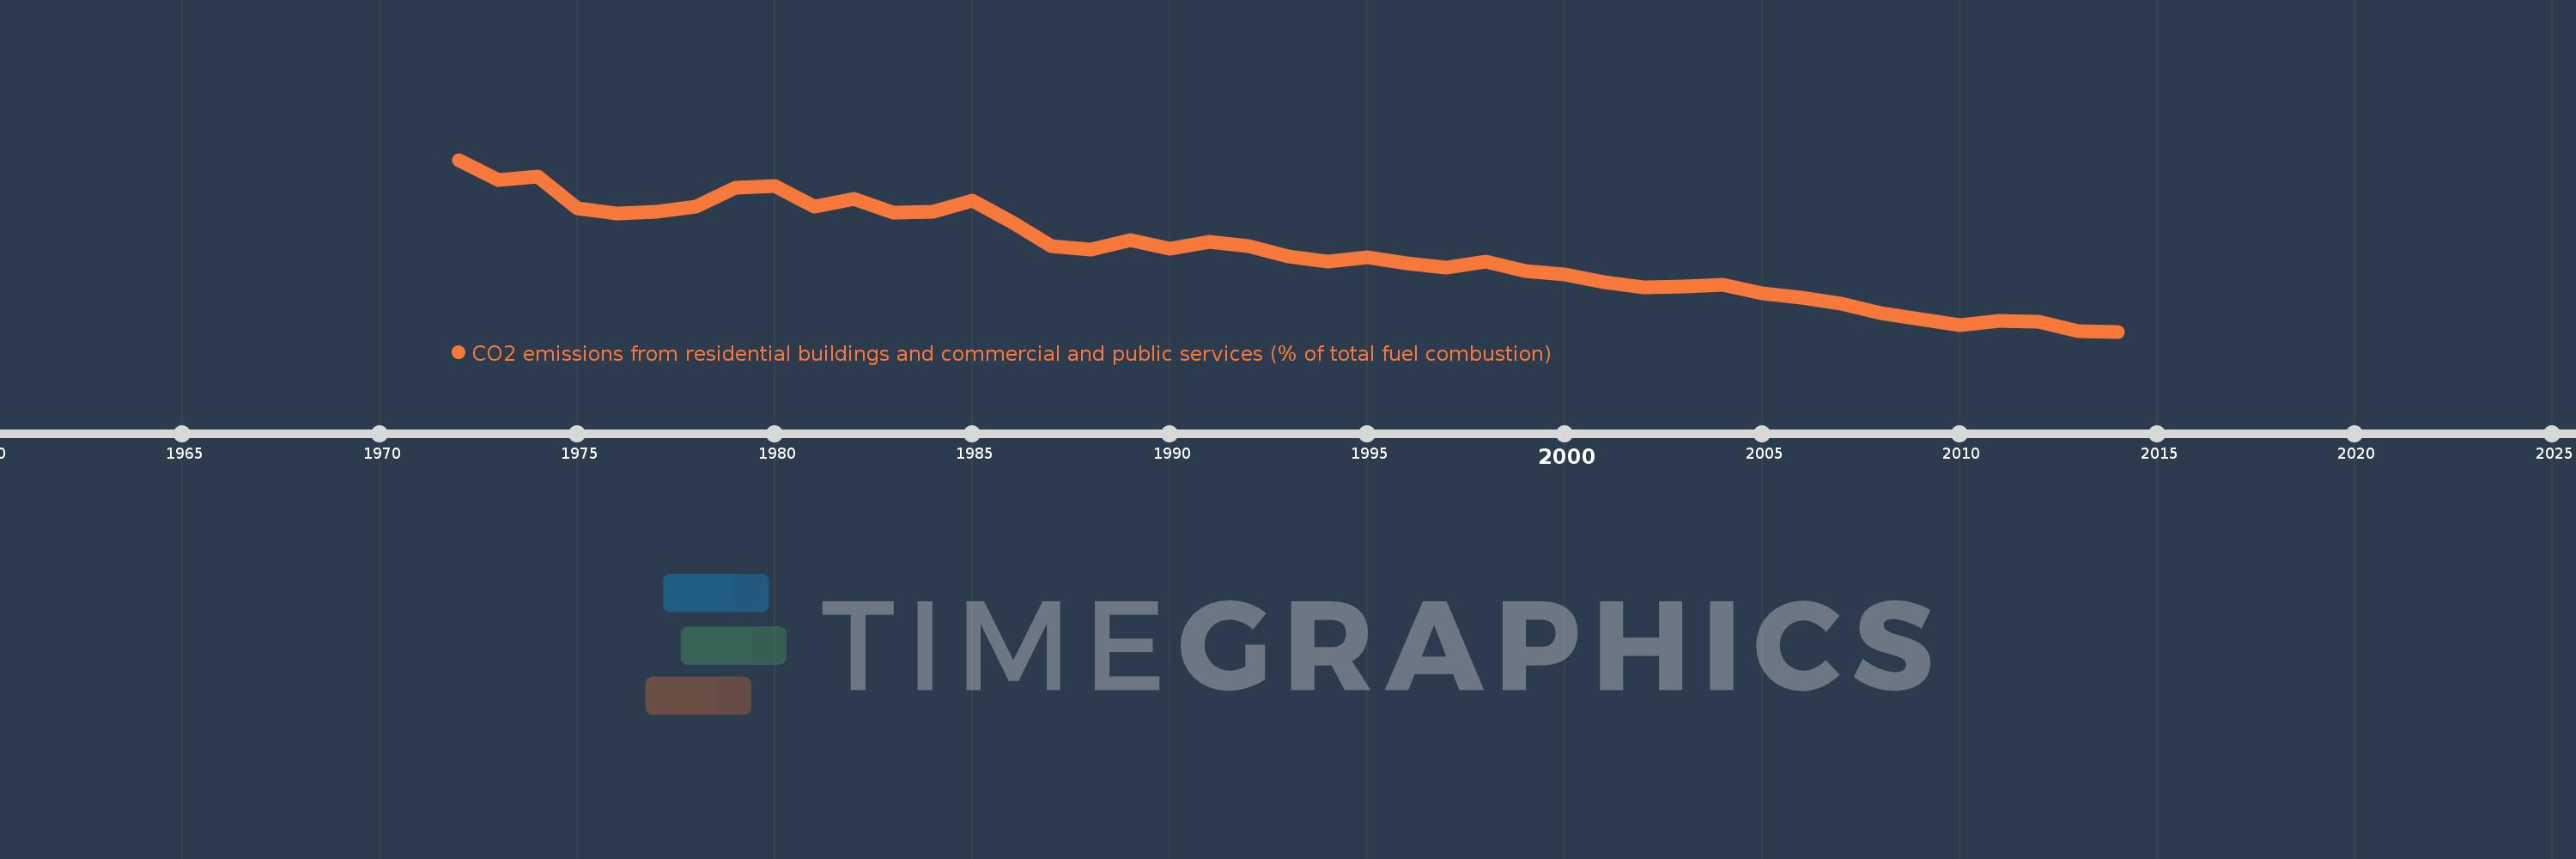
CO2 emissions from residential buildings and commercial and public services (% of total fuel combustion)
2014,2013,2012,2011,2010,2009,2008,2007,2006,2005,2004,2003,2002,2001,2000,1999,1998,1997,1996,1995,1994,1993,1992,1991,1990,1989,1988,1987,1986,1985,1984,1983,1982,1981,1980,1979,1978,1977,1976,1975,1974,1973,1972
This statistics in other country:
AlbaniaAlgeriaAngolaArab WorldArgentinaArmeniaAustraliaAustriaAzerbaijanBahrainBangladeshBelarusBelgiumBeninBoliviaBosnia and HerzegovinaBotswanaBrazilBrunei DarussalamBulgariaCambodiaCameroonCanadaCaribbean small statesCentral Europe and the BalticsChileChinaColombiaCongo, Dem. Rep.Congo, Rep.Costa RicaCote d'IvoireCroatiaCubaCuracaoCyprusCzech RepublicDenmarkDominican RepublicEarly-demographic dividendEast Asia & PacificEast Asia & Pacific (excluding high income)East Asia & Pacific (IDA & IBRD countries)EcuadorEgypt, Arab Rep.El SalvadorEritreaEstoniaEthiopiaEuro areaEurope & Central AsiaEurope & Central Asia (excluding high income)Europe & Central Asia (IDA & IBRD countries)European UnionFinlandFragile and conflict affected situationsFranceGabonGeorgiaGermanyGhanaGibraltarGreeceGuatemalaHaitiHeavily indebted poor countries (HIPC)High incomeHondurasHong Kong SAR, ChinaHungaryIBRD onlyIcelandIDA & IBRD totalIDA blendIDA onlyIDA totalIndiaIndonesiaIran, Islamic Rep.IraqIrelandIsraelItalyJamaicaJapanJordanKazakhstanKenyaKorea, Dem. People’s Rep.Korea, Rep.KosovoKuwaitKyrgyz RepublicLate-demographic dividendLatin America & Caribbean Latin America & Caribbean (excluding high income)Latin America & the Caribbean (IDA & IBRD countries)LatviaLeast developed countries: UN classificationLebanonLibyaLithuaniaLow & middle incomeLow incomeLower middle incomeLuxembourgMacedonia, FYRMalaysiaMaltaMauritiusMexicoMiddle East & North AfricaMiddle East & North Africa (excluding high income)Middle East & North Africa (IDA & IBRD countries)Middle incomeMoldovaMongoliaMontenegroMoroccoMozambiqueMyanmarNamibiaNepalNetherlandsNew ZealandNicaraguaNigerNigeriaNorth AmericaNorwayOECD membersOmanOther small statesPakistanPanamaParaguayPeruPhilippinesPolandPortugalPost-demographic dividendPre-demographic dividendQatarRomaniaRussian FederationSaudi ArabiaSenegalSerbiaSingaporeSlovak RepublicSloveniaSmall statesSouth AfricaSouth AsiaSouth Asia (IDA & IBRD)South SudanSpainSri LankaSub-Saharan Africa Sub-Saharan Africa (excluding high income)Sub-Saharan Africa (IDA & IBRD countries)SudanSwedenSwitzerlandSyrian Arab RepublicTajikistanTanzaniaThailandTogoTrinidad and TobagoTunisiaTurkeyTurkmenistanUkraineUnited Arab EmiratesUnited KingdomUnited StatesUpper middle incomeUruguayUzbekistanVenezuela, RBVietnamWorldYemen, Rep.ZambiaZimbabwe Timeline:
This timeline shows a graph from 1972 to 2014 of India. No data until 1971. Number of actual observations by date: 43.
Source name:
World Development Indicators
Source organization:
IEA Statistics © OECD/IEA 2014 (http://www.iea.org/stats/index.asp), subject to https://www.iea.org/t&c/termsandconditions/
Categories, topics:
Environment
Last updated:
apr 23, 2017
Indicators value changes by year
At the date of observation
Value
Absolute change
Change from previous value
jan 1, 1972
15.1
+15.1
0.0%
jan 1, 1973
14.047
-1.053
-6.98%
jan 1, 1974
14.202
+0.155
1.1%
jan 1, 1975
12.515
-1.687
-11.88%
jan 1, 1976
12.22
-0.296
-2.36%
jan 1, 1977
12.339
+0.119
0.97%
jan 1, 1978
12.606
+0.268
2.17%
jan 1, 1979
13.597
+0.99
7.86%
jan 1, 1980
13.716
+0.119
0.87%
jan 1, 1981
12.62
-1.095
-7.99%
jan 1, 1982
13.006
+0.386
3.06%
jan 1, 1983
12.276
-0.73
-5.61%
jan 1, 1984
12.346
+0.07
0.57%
jan 1, 1985
12.939
+0.592
4.8%
jan 1, 1986
11.791
-1.148
-8.87%
jan 1, 1987
10.506
-1.285
-10.89%
jan 1, 1988
10.317
-0.189
-1.8%
jan 1, 1989
10.816
+0.499
4.84%
jan 1, 1990
10.37
-0.446
-4.12%
jan 1, 1991
10.74
+0.37
3.57%
jan 1, 1992
10.502
-0.238
-2.21%
jan 1, 1993
9.971
-0.532
-5.06%
jan 1, 1994
9.678
-0.293
-2.94%
jan 1, 1995
9.888
+0.21
2.17%
jan 1, 1996
9.567
-0.321
-3.24%
jan 1, 1997
9.378
-0.189
-1.98%
jan 1, 1998
9.675
+0.297
3.17%
jan 1, 1999
9.153
-0.522
-5.39%
jan 1, 2000
8.976
-0.177
-1.94%
jan 1, 2001
8.561
-0.415
-4.63%
jan 1, 2002
8.284
-0.277
-3.23%
jan 1, 2003
8.37
+0.086
1.04%
jan 1, 2004
8.447
+0.077
0.92%
jan 1, 2005
8.003
-0.444
-5.26%
jan 1, 2006
7.773
-0.23
-2.88%
jan 1, 2007
7.434
-0.339
-4.36%
jan 1, 2008
6.93
-0.504
-6.78%
jan 1, 2009
6.6
-0.331
-4.77%
jan 1, 2010
6.298
-0.301
-4.57%
jan 1, 2011
6.518
+0.219
3.48%
jan 1, 2012
6.452
-0.066
-1.01%
jan 1, 2013
5.963
-0.489
-7.57%
jan 1, 2014
5.946
-0.017
-0.28%
Ranking of countries by current statistics by years


Comments: