29
/
en
AIzaSyAYiBZKx7MnpbEhh9jyipgxe19OcubqV5w
April 1, 2024
39770
IDA total
IDA
false
2
1
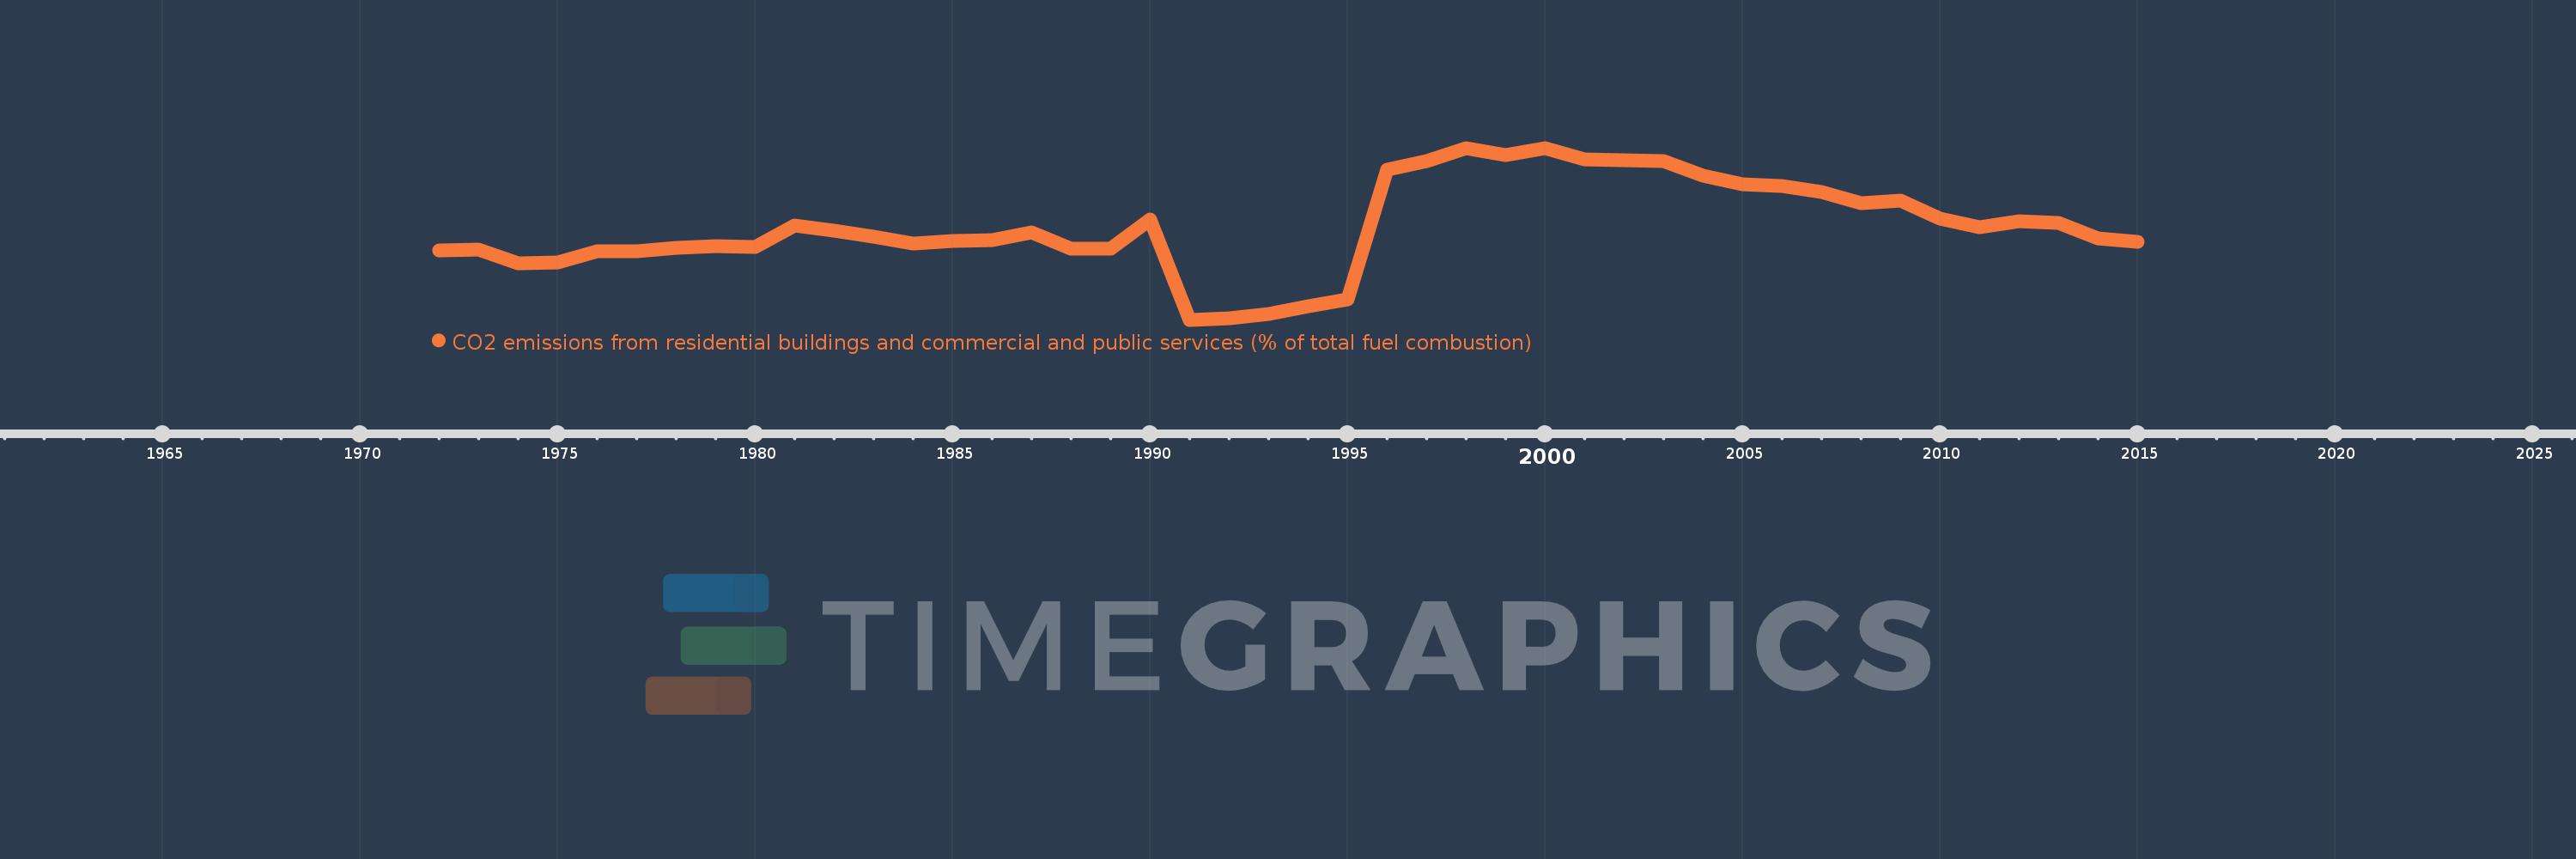
CO2 emissions from residential buildings and commercial and public services (% of total fuel combustion)
2015,2014,2013,2012,2011,2010,2009,2008,2007,2006,2005,2004,2003,2002,2001,2000,1999,1998,1997,1996,1995,1994,1993,1992,1991,1990,1989,1988,1987,1986,1985,1984,1983,1982,1981,1980,1979,1978,1977,1976,1975,1974,1973,1972
This statistics in other country:
AlbaniaAlgeriaAngolaArab WorldArgentinaArmeniaAustraliaAustriaAzerbaijanBahrainBangladeshBelarusBelgiumBeninBoliviaBosnia and HerzegovinaBotswanaBrazilBrunei DarussalamBulgariaCambodiaCameroonCanadaCaribbean small statesCentral Europe and the BalticsChileChinaColombiaCongo, Dem. Rep.Congo, Rep.Costa RicaCote d'IvoireCroatiaCubaCuracaoCyprusCzech RepublicDenmarkDominican RepublicEarly-demographic dividendEast Asia & PacificEast Asia & Pacific (excluding high income)East Asia & Pacific (IDA & IBRD countries)EcuadorEgypt, Arab Rep.El SalvadorEritreaEstoniaEthiopiaEuro areaEurope & Central AsiaEurope & Central Asia (excluding high income)Europe & Central Asia (IDA & IBRD countries)European UnionFinlandFragile and conflict affected situationsFranceGabonGeorgiaGermanyGhanaGibraltarGreeceGuatemalaHaitiHeavily indebted poor countries (HIPC)High incomeHondurasHong Kong SAR, ChinaHungaryIBRD onlyIcelandIDA & IBRD totalIDA blendIDA onlyIDA totalIndiaIndonesiaIran, Islamic Rep.IraqIrelandIsraelItalyJamaicaJapanJordanKazakhstanKenyaKorea, Dem. People’s Rep.Korea, Rep.KosovoKuwaitKyrgyz RepublicLate-demographic dividendLatin America & Caribbean Latin America & Caribbean (excluding high income)Latin America & the Caribbean (IDA & IBRD countries)LatviaLeast developed countries: UN classificationLebanonLibyaLithuaniaLow & middle incomeLow incomeLower middle incomeLuxembourgMacedonia, FYRMalaysiaMaltaMauritiusMexicoMiddle East & North AfricaMiddle East & North Africa (excluding high income)Middle East & North Africa (IDA & IBRD countries)Middle incomeMoldovaMongoliaMontenegroMoroccoMozambiqueMyanmarNamibiaNepalNetherlandsNew ZealandNicaraguaNigerNigeriaNorth AmericaNorwayOECD membersOmanOther small statesPakistanPanamaParaguayPeruPhilippinesPolandPortugalPost-demographic dividendPre-demographic dividendQatarRomaniaRussian FederationSaudi ArabiaSenegalSerbiaSingaporeSlovak RepublicSloveniaSmall statesSouth AfricaSouth AsiaSouth Asia (IDA & IBRD)South SudanSpainSri LankaSub-Saharan Africa Sub-Saharan Africa (excluding high income)Sub-Saharan Africa (IDA & IBRD countries)SudanSwedenSwitzerlandSyrian Arab RepublicTajikistanTanzaniaThailandTogoTrinidad and TobagoTunisiaTurkeyTurkmenistanUkraineUnited Arab EmiratesUnited KingdomUnited StatesUpper middle incomeUruguayUzbekistanVenezuela, RBVietnamWorldYemen, Rep.ZambiaZimbabwe Timeline:
This timeline shows a graph from 1972 to 2015 of IDA total. No data until 1971. Number of actual observations by date: 44.
Source name:
World Development Indicators
Source organization:
IEA Statistics © OECD/IEA 2014 (http://www.iea.org/stats/index.asp), subject to https://www.iea.org/t&c/termsandconditions/
Categories, topics:
Environment
Last updated:
apr 23, 2017
Indicators value changes by year
Maximum:
17.471
jan 1, 1998
At the date of observation
Value
Absolute change
Change from previous value
jan 1, 1972
11.202
+11.202
0.0%
jan 1, 1973
11.254
+0.052
0.47%
jan 1, 1974
10.432
-0.822
-7.31%
jan 1, 1975
10.471
+0.039
0.37%
jan 1, 1976
11.164
+0.693
6.62%
jan 1, 1977
11.18
+0.016
0.14%
jan 1, 1978
11.381
+0.201
1.79%
jan 1, 1979
11.468
+0.087
0.76%
jan 1, 1980
11.402
-0.066
-0.57%
jan 1, 1981
12.723
+1.321
11.59%
jan 1, 1982
12.414
-0.309
-2.43%
jan 1, 1983
12.062
-0.352
-2.83%
jan 1, 1984
11.64
-0.422
-3.5%
jan 1, 1985
11.805
+0.165
1.42%
jan 1, 1986
11.849
+0.044
0.37%
jan 1, 1987
12.297
+0.447
3.77%
jan 1, 1988
11.319
-0.978
-7.95%
jan 1, 1989
11.306
-0.013
-0.11%
jan 1, 1990
13.098
+1.792
15.85%
jan 1, 1991
6.988
-6.11
-46.65%
jan 1, 1992
7.08
+0.092
1.31%
jan 1, 1993
7.335
+0.255
3.6%
jan 1, 1994
7.789
+0.454
6.19%
jan 1, 1995
8.213
+0.424
5.45%
jan 1, 1996
16.137
+7.924
96.47%
jan 1, 1997
16.645
+0.508
3.15%
jan 1, 1998
17.471
+0.826
4.96%
jan 1, 1999
17.042
-0.43
-2.46%
jan 1, 2000
17.468
+0.427
2.5%
jan 1, 2001
16.789
-0.679
-3.89%
jan 1, 2002
16.718
-0.072
-0.43%
jan 1, 2003
16.669
-0.049
-0.29%
jan 1, 2004
15.79
-0.878
-5.27%
jan 1, 2005
15.23
-0.56
-3.54%
jan 1, 2006
15.153
-0.078
-0.51%
jan 1, 2007
14.779
-0.374
-2.47%
jan 1, 2008
14.083
-0.695
-4.71%
jan 1, 2009
14.251
+0.168
1.19%
jan 1, 2010
13.169
-1.082
-7.59%
jan 1, 2011
12.625
-0.544
-4.13%
jan 1, 2012
12.995
+0.369
2.92%
jan 1, 2013
12.921
-0.074
-0.57%
jan 1, 2014
11.955
-0.966
-7.47%
jan 1, 2015
11.75
-0.205
-1.72%
Ranking of countries by current statistics by years


Comments: