29
/
en
AIzaSyAYiBZKx7MnpbEhh9jyipgxe19OcubqV5w
April 1, 2024
67534
Angola
AGO
true
2
1
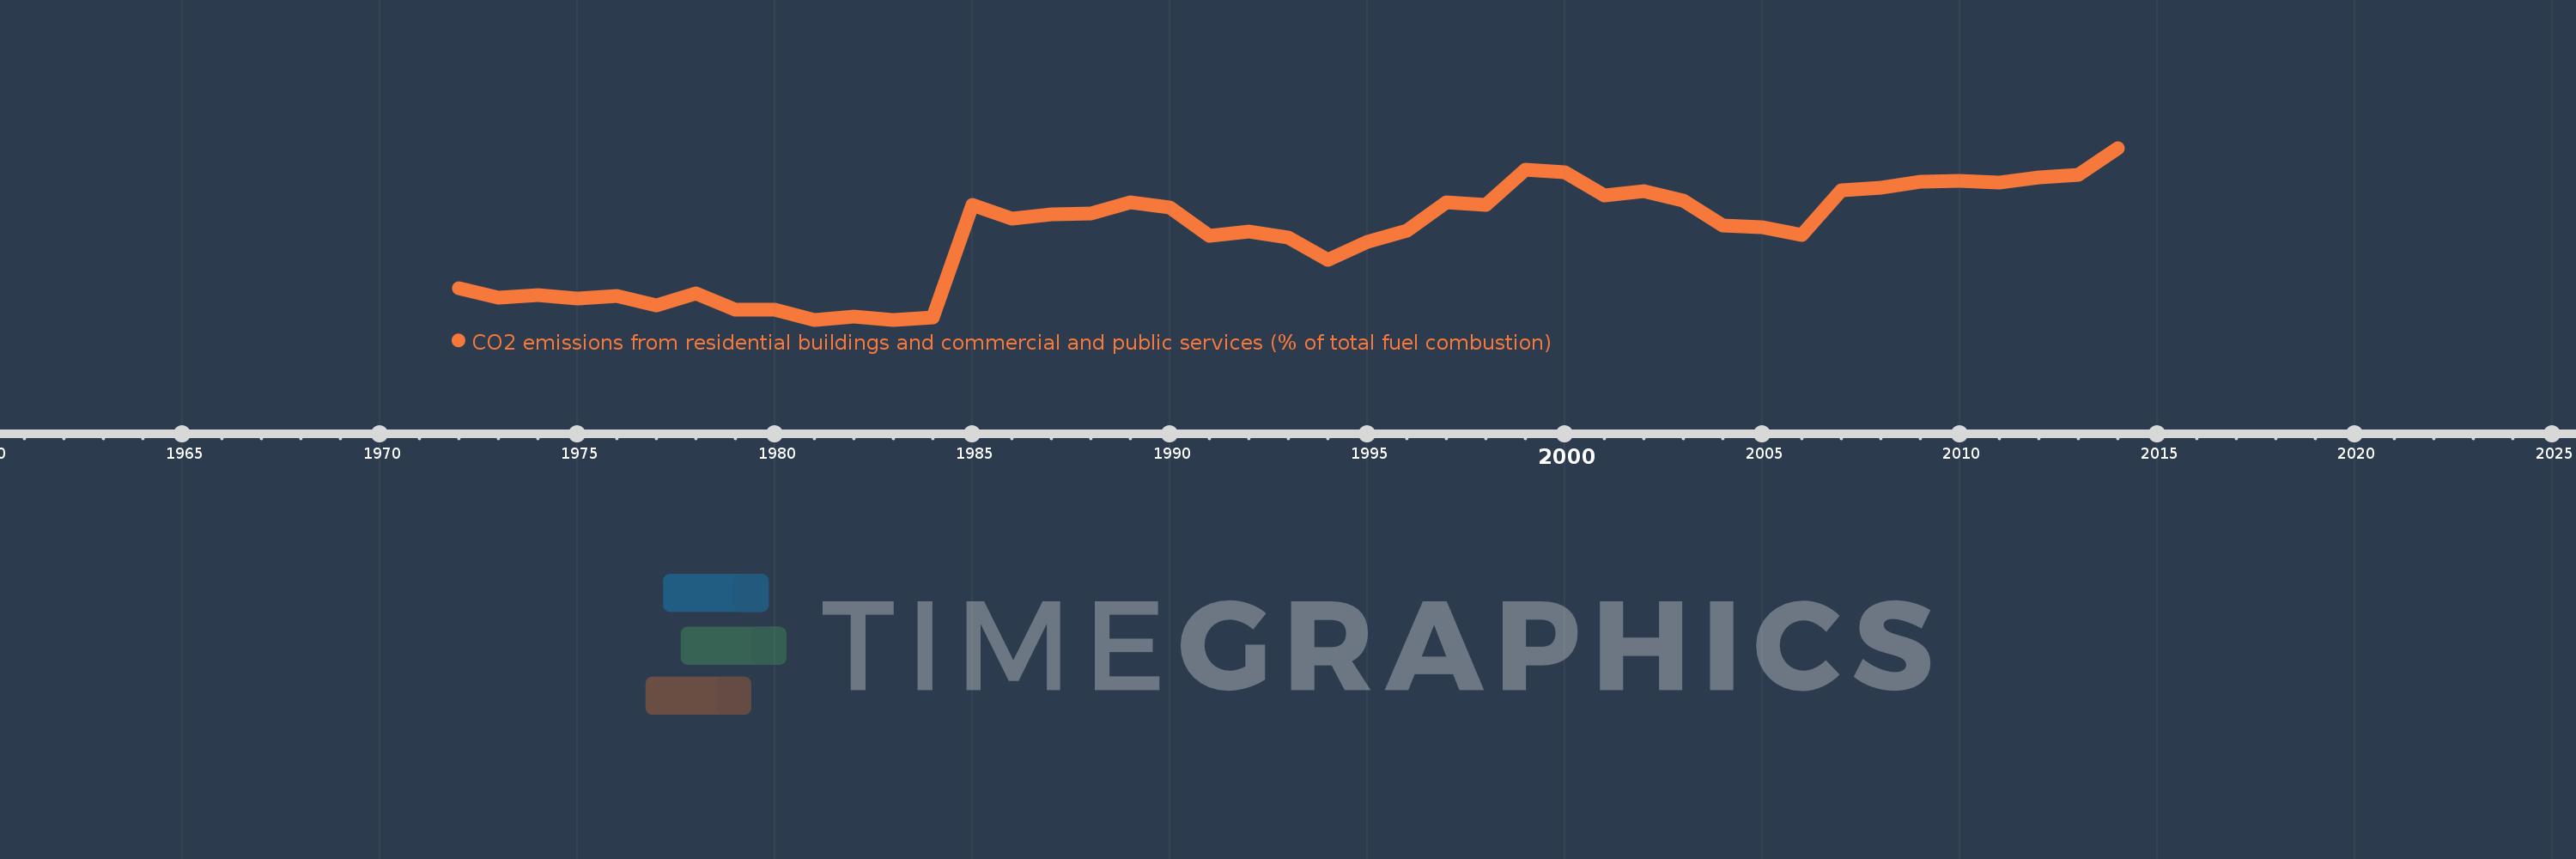
CO2 emissions from residential buildings and commercial and public services (% of total fuel combustion)
2014,2013,2012,2011,2010,2009,2008,2007,2006,2005,2004,2003,2002,2001,2000,1999,1998,1997,1996,1995,1994,1993,1992,1991,1990,1989,1988,1987,1986,1985,1984,1983,1982,1981,1980,1979,1978,1977,1976,1975,1974,1973,1972
This statistics in other country:
AlbaniaAlgeriaAngolaArab WorldArgentinaArmeniaAustraliaAustriaAzerbaijanBahrainBangladeshBelarusBelgiumBeninBoliviaBosnia and HerzegovinaBotswanaBrazilBrunei DarussalamBulgariaCambodiaCameroonCanadaCaribbean small statesCentral Europe and the BalticsChileChinaColombiaCongo, Dem. Rep.Congo, Rep.Costa RicaCote d'IvoireCroatiaCubaCuracaoCyprusCzech RepublicDenmarkDominican RepublicEarly-demographic dividendEast Asia & PacificEast Asia & Pacific (excluding high income)East Asia & Pacific (IDA & IBRD countries)EcuadorEgypt, Arab Rep.El SalvadorEritreaEstoniaEthiopiaEuro areaEurope & Central AsiaEurope & Central Asia (excluding high income)Europe & Central Asia (IDA & IBRD countries)European UnionFinlandFragile and conflict affected situationsFranceGabonGeorgiaGermanyGhanaGibraltarGreeceGuatemalaHaitiHeavily indebted poor countries (HIPC)High incomeHondurasHong Kong SAR, ChinaHungaryIBRD onlyIcelandIDA & IBRD totalIDA blendIDA onlyIDA totalIndiaIndonesiaIran, Islamic Rep.IraqIrelandIsraelItalyJamaicaJapanJordanKazakhstanKenyaKorea, Dem. People’s Rep.Korea, Rep.KosovoKuwaitKyrgyz RepublicLate-demographic dividendLatin America & Caribbean Latin America & Caribbean (excluding high income)Latin America & the Caribbean (IDA & IBRD countries)LatviaLeast developed countries: UN classificationLebanonLibyaLithuaniaLow & middle incomeLow incomeLower middle incomeLuxembourgMacedonia, FYRMalaysiaMaltaMauritiusMexicoMiddle East & North AfricaMiddle East & North Africa (excluding high income)Middle East & North Africa (IDA & IBRD countries)Middle incomeMoldovaMongoliaMontenegroMoroccoMozambiqueMyanmarNamibiaNepalNetherlandsNew ZealandNicaraguaNigerNigeriaNorth AmericaNorwayOECD membersOmanOther small statesPakistanPanamaParaguayPeruPhilippinesPolandPortugalPost-demographic dividendPre-demographic dividendQatarRomaniaRussian FederationSaudi ArabiaSenegalSerbiaSingaporeSlovak RepublicSloveniaSmall statesSouth AfricaSouth AsiaSouth Asia (IDA & IBRD)South SudanSpainSri LankaSub-Saharan Africa Sub-Saharan Africa (excluding high income)Sub-Saharan Africa (IDA & IBRD countries)SudanSwedenSwitzerlandSyrian Arab RepublicTajikistanTanzaniaThailandTogoTrinidad and TobagoTunisiaTurkeyTurkmenistanUkraineUnited Arab EmiratesUnited KingdomUnited StatesUpper middle incomeUruguayUzbekistanVenezuela, RBVietnamWorldYemen, Rep.ZambiaZimbabwe Timeline:
This timeline shows a graph from 1972 to 2014 of Angola. No data until 1971. Number of actual observations by date: 43.
Source name:
World Development Indicators
Source organization:
IEA Statistics © OECD/IEA 2014 (http://www.iea.org/stats/index.asp), subject to https://www.iea.org/t&c/termsandconditions/
Categories, topics:
Environment
Last updated:
apr 23, 2017
Indicators value changes by year
Maximum:
30.395
jan 1, 2014
At the date of observation
Value
Absolute change
Change from previous value
jan 1, 1972
7.407
+7.407
0.0%
jan 1, 1973
5.833
-1.574
-21.25%
jan 1, 1974
6.364
+0.53
9.09%
jan 1, 1975
5.778
-0.586
-9.21%
jan 1, 1976
6.122
+0.345
5.97%
jan 1, 1977
4.639
-1.483
-24.23%
jan 1, 1978
6.623
+1.983
42.75%
jan 1, 1979
3.876
-2.747
-41.47%
jan 1, 1980
3.937
+0.061
1.57%
jan 1, 1981
2.256
-1.681
-42.71%
jan 1, 1982
2.778
+0.522
23.15%
jan 1, 1983
2.273
-0.505
-18.18%
jan 1, 1984
2.586
+0.313
13.79%
jan 1, 1985
21.076
+18.49
714.95%
jan 1, 1986
18.794
-2.282
-10.83%
jan 1, 1987
19.495
+0.7
3.73%
jan 1, 1988
19.649
+0.155
0.79%
jan 1, 1989
21.495
+1.846
9.4%
jan 1, 1990
20.606
-0.889
-4.14%
jan 1, 1991
16.071
-4.535
-22.01%
jan 1, 1992
16.708
+0.637
3.96%
jan 1, 1993
15.681
-1.027
-6.15%
jan 1, 1994
12.085
-3.596
-22.93%
jan 1, 1995
15.072
+2.986
24.71%
jan 1, 1996
16.88
+1.808
12.0%
jan 1, 1997
21.48
+4.6
27.25%
jan 1, 1998
21.016
-0.464
-2.16%
jan 1, 1999
26.81
+5.793
27.57%
jan 1, 2000
26.371
-0.438
-1.64%
jan 1, 2001
22.678
-3.693
-14.0%
jan 1, 2002
23.26
+0.582
2.57%
jan 1, 2003
21.818
-1.442
-6.2%
jan 1, 2004
17.705
-4.113
-18.85%
jan 1, 2005
17.432
-0.273
-1.54%
jan 1, 2006
16.098
-1.335
-7.66%
jan 1, 2007
23.394
+7.296
45.33%
jan 1, 2008
23.859
+0.465
1.99%
jan 1, 2009
24.809
+0.951
3.98%
jan 1, 2010
25.018
+0.209
0.84%
jan 1, 2011
24.686
-0.332
-1.33%
jan 1, 2012
25.56
+0.874
3.54%
jan 1, 2013
26.013
+0.453
1.77%
jan 1, 2014
30.395
+4.382
16.85%
Ranking of countries by current statistics by years


Comments: