29
/
en
AIzaSyAYiBZKx7MnpbEhh9jyipgxe19OcubqV5w
April 1, 2024
41286
Latin America & Caribbean
LCN
false
2
1
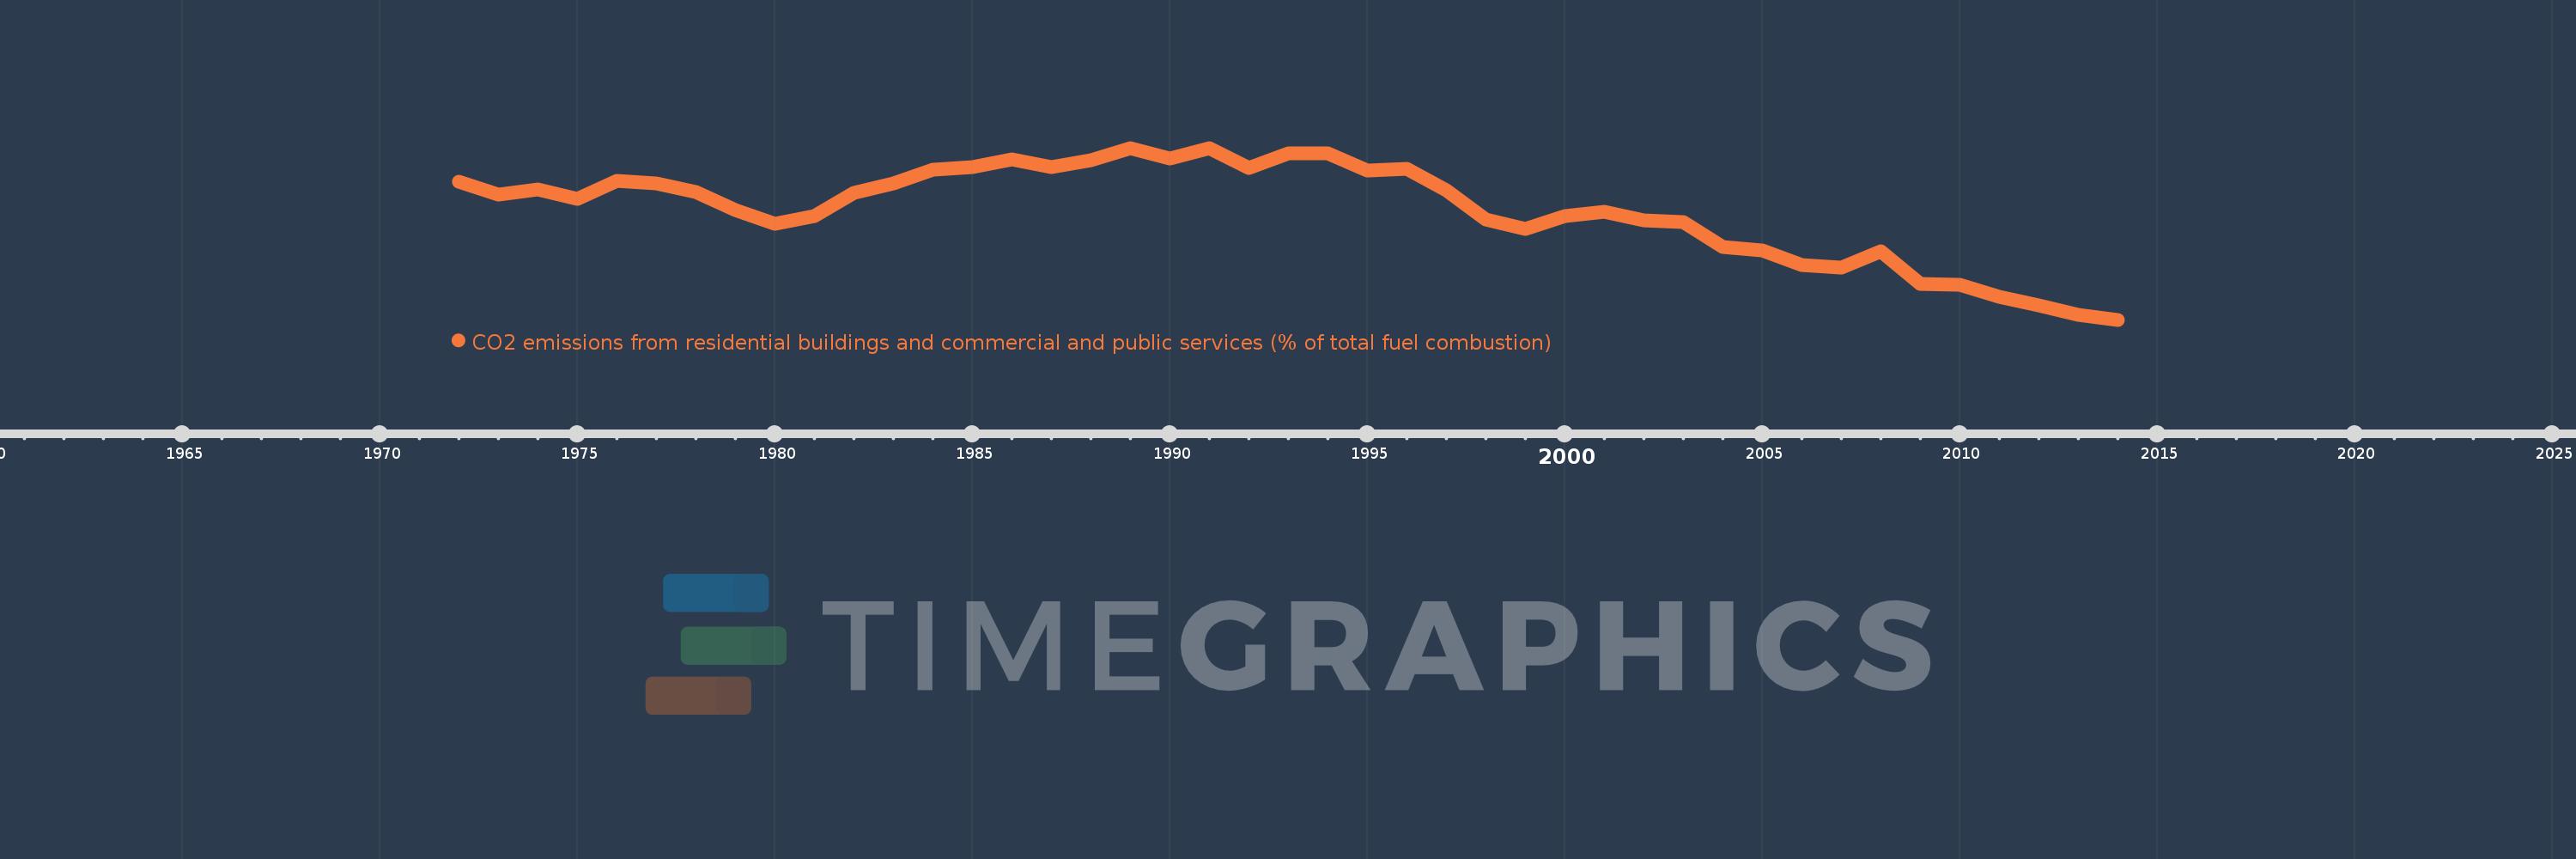
CO2 emissions from residential buildings and commercial and public services (% of total fuel combustion)
2014,2013,2012,2011,2010,2009,2008,2007,2006,2005,2004,2003,2002,2001,2000,1999,1998,1997,1996,1995,1994,1993,1992,1991,1990,1989,1988,1987,1986,1985,1984,1983,1982,1981,1980,1979,1978,1977,1976,1975,1974,1973,1972
This statistics in other country:
AlbaniaAlgeriaAngolaArab WorldArgentinaArmeniaAustraliaAustriaAzerbaijanBahrainBangladeshBelarusBelgiumBeninBoliviaBosnia and HerzegovinaBotswanaBrazilBrunei DarussalamBulgariaCambodiaCameroonCanadaCaribbean small statesCentral Europe and the BalticsChileChinaColombiaCongo, Dem. Rep.Congo, Rep.Costa RicaCote d'IvoireCroatiaCubaCuracaoCyprusCzech RepublicDenmarkDominican RepublicEarly-demographic dividendEast Asia & PacificEast Asia & Pacific (excluding high income)East Asia & Pacific (IDA & IBRD countries)EcuadorEgypt, Arab Rep.El SalvadorEritreaEstoniaEthiopiaEuro areaEurope & Central AsiaEurope & Central Asia (excluding high income)Europe & Central Asia (IDA & IBRD countries)European UnionFinlandFragile and conflict affected situationsFranceGabonGeorgiaGermanyGhanaGibraltarGreeceGuatemalaHaitiHeavily indebted poor countries (HIPC)High incomeHondurasHong Kong SAR, ChinaHungaryIBRD onlyIcelandIDA & IBRD totalIDA blendIDA onlyIDA totalIndiaIndonesiaIran, Islamic Rep.IraqIrelandIsraelItalyJamaicaJapanJordanKazakhstanKenyaKorea, Dem. People’s Rep.Korea, Rep.KosovoKuwaitKyrgyz RepublicLate-demographic dividendLatin America & Caribbean Latin America & Caribbean (excluding high income)Latin America & the Caribbean (IDA & IBRD countries)LatviaLeast developed countries: UN classificationLebanonLibyaLithuaniaLow & middle incomeLow incomeLower middle incomeLuxembourgMacedonia, FYRMalaysiaMaltaMauritiusMexicoMiddle East & North AfricaMiddle East & North Africa (excluding high income)Middle East & North Africa (IDA & IBRD countries)Middle incomeMoldovaMongoliaMontenegroMoroccoMozambiqueMyanmarNamibiaNepalNetherlandsNew ZealandNicaraguaNigerNigeriaNorth AmericaNorwayOECD membersOmanOther small statesPakistanPanamaParaguayPeruPhilippinesPolandPortugalPost-demographic dividendPre-demographic dividendQatarRomaniaRussian FederationSaudi ArabiaSenegalSerbiaSingaporeSlovak RepublicSloveniaSmall statesSouth AfricaSouth AsiaSouth Asia (IDA & IBRD)South SudanSpainSri LankaSub-Saharan Africa Sub-Saharan Africa (excluding high income)Sub-Saharan Africa (IDA & IBRD countries)SudanSwedenSwitzerlandSyrian Arab RepublicTajikistanTanzaniaThailandTogoTrinidad and TobagoTunisiaTurkeyTurkmenistanUkraineUnited Arab EmiratesUnited KingdomUnited StatesUpper middle incomeUruguayUzbekistanVenezuela, RBVietnamWorldYemen, Rep.ZambiaZimbabwe Timeline:
This timeline shows a graph from 1972 to 2014 of Latin America & Caribbean . No data until 1971. Number of actual observations by date: 43.
Source name:
World Development Indicators
Source organization:
IEA Statistics © OECD/IEA 2014 (http://www.iea.org/stats/index.asp), subject to https://www.iea.org/t&c/termsandconditions/
Categories, topics:
Environment
Last updated:
apr 23, 2017
Indicators value changes by year
At the date of observation
Value
Absolute change
Change from previous value
jan 1, 1972
8.739
+8.739
0.0%
jan 1, 1973
8.513
-0.226
-2.59%
jan 1, 1974
8.603
+0.09
1.06%
jan 1, 1975
8.433
-0.17
-1.98%
jan 1, 1976
8.761
+0.329
3.9%
jan 1, 1977
8.713
-0.048
-0.55%
jan 1, 1978
8.562
-0.151
-1.74%
jan 1, 1979
8.238
-0.324
-3.79%
jan 1, 1980
7.987
-0.251
-3.05%
jan 1, 1981
8.117
+0.13
1.63%
jan 1, 1982
8.549
+0.432
5.33%
jan 1, 1983
8.716
+0.167
1.95%
jan 1, 1984
8.961
+0.246
2.82%
jan 1, 1985
9.0
+0.039
0.43%
jan 1, 1986
9.151
+0.151
1.67%
jan 1, 1987
9.002
-0.149
-1.63%
jan 1, 1988
9.135
+0.133
1.48%
jan 1, 1989
9.344
+0.209
2.29%
jan 1, 1990
9.16
-0.185
-1.98%
jan 1, 1991
9.352
+0.192
2.1%
jan 1, 1992
8.993
-0.358
-3.83%
jan 1, 1993
9.259
+0.265
2.95%
jan 1, 1994
9.255
-0.004
-0.04%
jan 1, 1995
8.947
-0.309
-3.33%
jan 1, 1996
8.978
+0.031
0.35%
jan 1, 1997
8.585
-0.393
-4.38%
jan 1, 1998
8.068
-0.517
-6.02%
jan 1, 1999
7.889
-0.18
-2.23%
jan 1, 2000
8.13
+0.241
3.05%
jan 1, 2001
8.207
+0.077
0.95%
jan 1, 2002
8.049
-0.158
-1.92%
jan 1, 2003
8.011
-0.039
-0.48%
jan 1, 2004
7.562
-0.449
-5.6%
jan 1, 2005
7.502
-0.06
-0.79%
jan 1, 2006
7.249
-0.253
-3.37%
jan 1, 2007
7.198
-0.051
-0.71%
jan 1, 2008
7.49
+0.292
4.06%
jan 1, 2009
6.894
-0.596
-7.96%
jan 1, 2010
6.887
-0.008
-0.11%
jan 1, 2011
6.671
-0.215
-3.13%
jan 1, 2012
6.507
-0.164
-2.46%
jan 1, 2013
6.338
-0.169
-2.6%
jan 1, 2014
6.255
-0.083
-1.31%
Ranking of countries by current statistics by years


Comments: