29
/
en
AIzaSyAYiBZKx7MnpbEhh9jyipgxe19OcubqV5w
April 1, 2024
110696
Congo, Rep.
COG
true
2
1
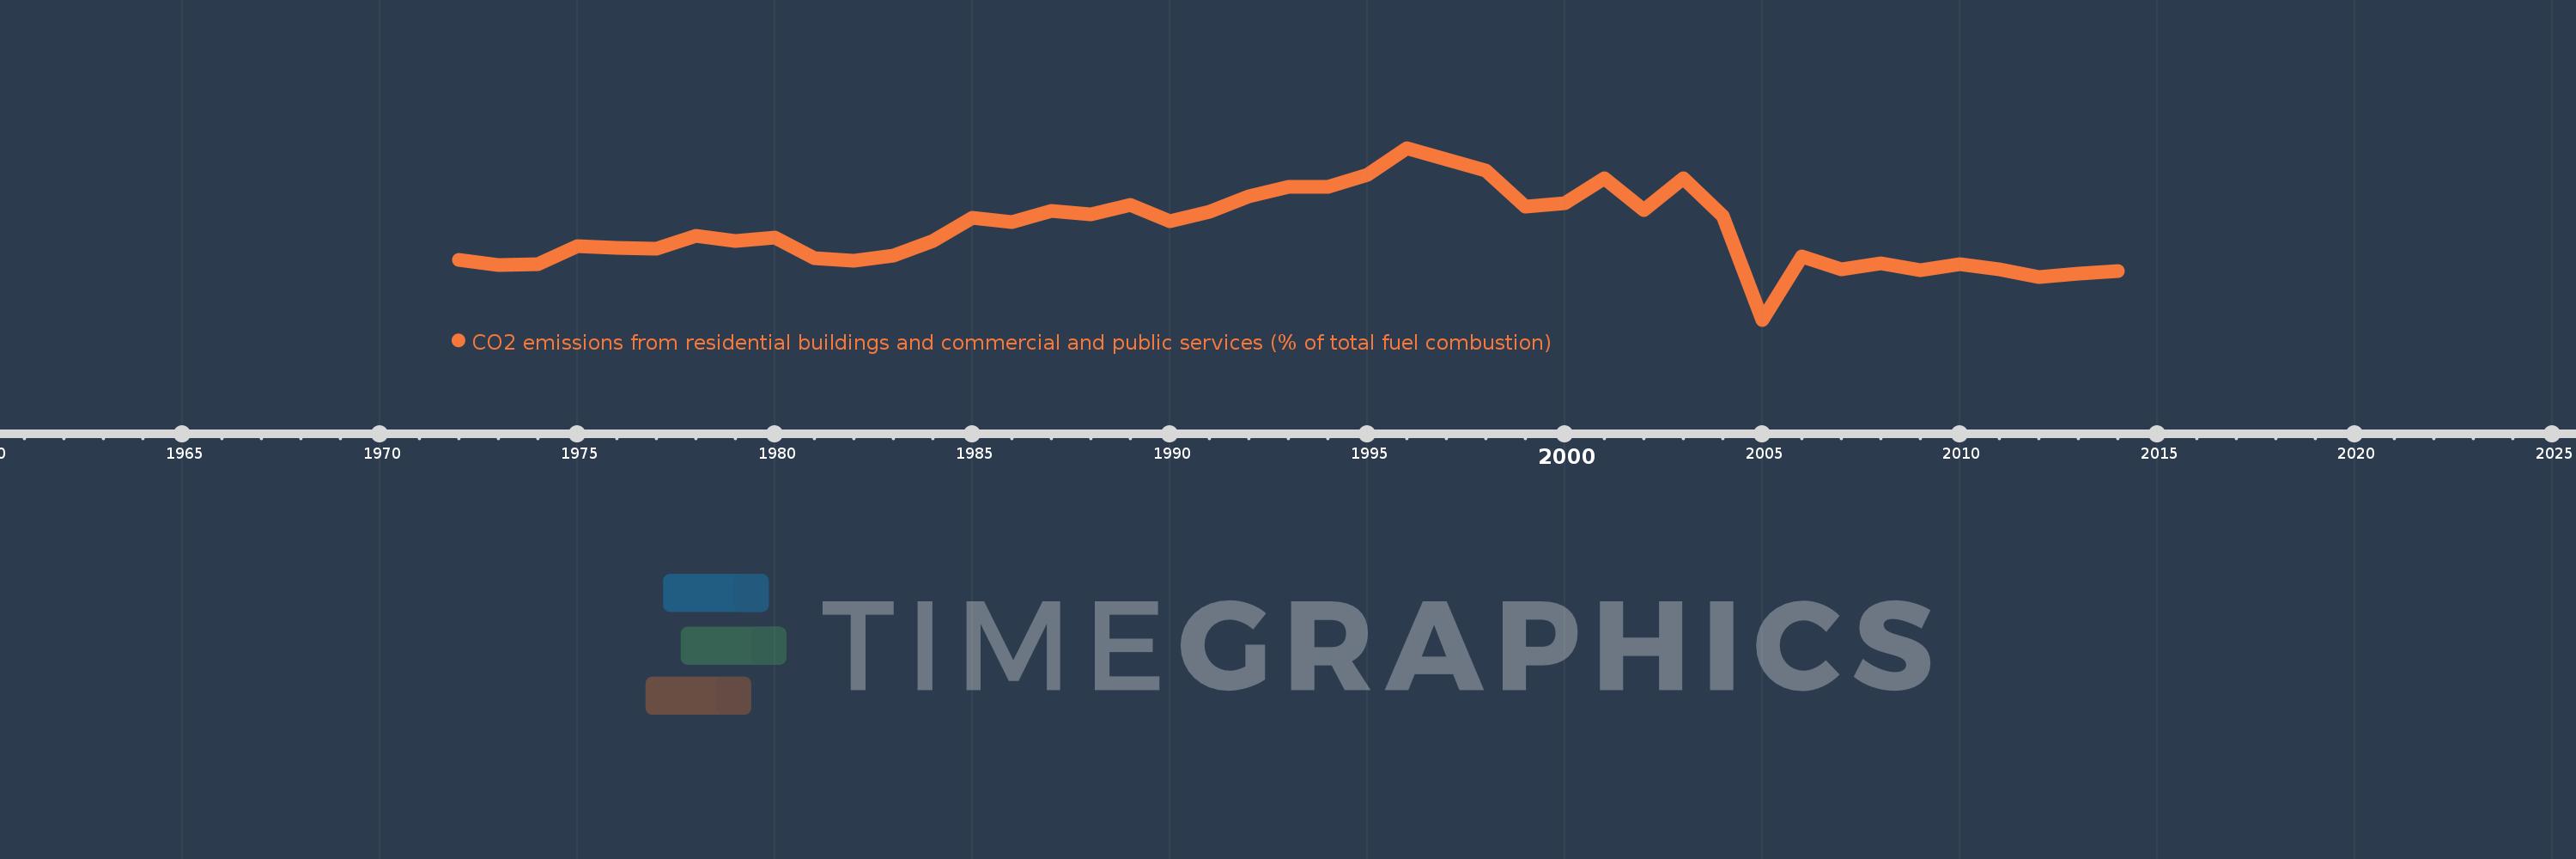
CO2 emissions from residential buildings and commercial and public services (% of total fuel combustion)
2014,2013,2012,2011,2010,2009,2008,2007,2006,2005,2004,2003,2002,2001,2000,1999,1998,1997,1996,1995,1994,1993,1992,1991,1990,1989,1988,1987,1986,1985,1984,1983,1982,1981,1980,1979,1978,1977,1976,1975,1974,1973,1972
This statistics in other country:
AlbaniaAlgeriaAngolaArab WorldArgentinaArmeniaAustraliaAustriaAzerbaijanBahrainBangladeshBelarusBelgiumBeninBoliviaBosnia and HerzegovinaBotswanaBrazilBrunei DarussalamBulgariaCambodiaCameroonCanadaCaribbean small statesCentral Europe and the BalticsChileChinaColombiaCongo, Dem. Rep.Congo, Rep.Costa RicaCote d'IvoireCroatiaCubaCuracaoCyprusCzech RepublicDenmarkDominican RepublicEarly-demographic dividendEast Asia & PacificEast Asia & Pacific (excluding high income)East Asia & Pacific (IDA & IBRD countries)EcuadorEgypt, Arab Rep.El SalvadorEritreaEstoniaEthiopiaEuro areaEurope & Central AsiaEurope & Central Asia (excluding high income)Europe & Central Asia (IDA & IBRD countries)European UnionFinlandFragile and conflict affected situationsFranceGabonGeorgiaGermanyGhanaGibraltarGreeceGuatemalaHaitiHeavily indebted poor countries (HIPC)High incomeHondurasHong Kong SAR, ChinaHungaryIBRD onlyIcelandIDA & IBRD totalIDA blendIDA onlyIDA totalIndiaIndonesiaIran, Islamic Rep.IraqIrelandIsraelItalyJamaicaJapanJordanKazakhstanKenyaKorea, Dem. People’s Rep.Korea, Rep.KosovoKuwaitKyrgyz RepublicLate-demographic dividendLatin America & Caribbean Latin America & Caribbean (excluding high income)Latin America & the Caribbean (IDA & IBRD countries)LatviaLeast developed countries: UN classificationLebanonLibyaLithuaniaLow & middle incomeLow incomeLower middle incomeLuxembourgMacedonia, FYRMalaysiaMaltaMauritiusMexicoMiddle East & North AfricaMiddle East & North Africa (excluding high income)Middle East & North Africa (IDA & IBRD countries)Middle incomeMoldovaMongoliaMontenegroMoroccoMozambiqueMyanmarNamibiaNepalNetherlandsNew ZealandNicaraguaNigerNigeriaNorth AmericaNorwayOECD membersOmanOther small statesPakistanPanamaParaguayPeruPhilippinesPolandPortugalPost-demographic dividendPre-demographic dividendQatarRomaniaRussian FederationSaudi ArabiaSenegalSerbiaSingaporeSlovak RepublicSloveniaSmall statesSouth AfricaSouth AsiaSouth Asia (IDA & IBRD)South SudanSpainSri LankaSub-Saharan Africa Sub-Saharan Africa (excluding high income)Sub-Saharan Africa (IDA & IBRD countries)SudanSwedenSwitzerlandSyrian Arab RepublicTajikistanTanzaniaThailandTogoTrinidad and TobagoTunisiaTurkeyTurkmenistanUkraineUnited Arab EmiratesUnited KingdomUnited StatesUpper middle incomeUruguayUzbekistanVenezuela, RBVietnamWorldYemen, Rep.ZambiaZimbabwe Timeline:
This timeline shows a graph from 1972 to 2014 of Congo, Rep.. No data until 1971. Number of actual observations by date: 43.
Source name:
World Development Indicators
Source organization:
IEA Statistics © OECD/IEA 2014 (http://www.iea.org/stats/index.asp), subject to https://www.iea.org/t&c/termsandconditions/
Categories, topics:
Environment
Last updated:
apr 23, 2017
Indicators value changes by year
Maximum:
17.778
jan 1, 1996
At the date of observation
Value
Absolute change
Change from previous value
jan 1, 1972
7.018
+7.018
0.0%
jan 1, 1973
6.557
-0.46
-6.56%
jan 1, 1974
6.667
+0.109
1.67%
jan 1, 1975
8.333
+1.667
25.0%
jan 1, 1976
8.197
-0.137
-1.64%
jan 1, 1977
8.108
-0.089
-1.08%
jan 1, 1978
9.375
+1.267
15.62%
jan 1, 1979
8.824
-0.551
-5.88%
jan 1, 1980
9.231
+0.407
4.62%
jan 1, 1981
7.246
-1.984
-21.5%
jan 1, 1982
6.944
-0.302
-4.17%
jan 1, 1983
7.5
+0.556
8.0%
jan 1, 1984
8.861
+1.361
18.14%
jan 1, 1985
11.111
+2.25
25.4%
jan 1, 1986
10.667
-0.444
-4.0%
jan 1, 1987
11.765
+1.098
10.29%
jan 1, 1988
11.429
-0.336
-2.86%
jan 1, 1989
12.308
+0.879
7.69%
jan 1, 1990
10.769
-1.538
-12.5%
jan 1, 1991
11.667
+0.897
8.33%
jan 1, 1992
13.115
+1.448
12.41%
jan 1, 1993
14.035
+0.92
7.02%
jan 1, 1994
14.035
0.0
0.0%
jan 1, 1995
15.217
+1.182
8.42%
jan 1, 1996
17.778
+2.56
16.83%
jan 1, 1997
16.667
-1.111
-6.25%
jan 1, 1998
15.625
-1.042
-6.25%
jan 1, 1999
12.121
-3.504
-22.42%
jan 1, 2000
12.5
+0.379
3.13%
jan 1, 2001
14.894
+2.394
19.15%
jan 1, 2002
11.864
-3.029
-20.34%
jan 1, 2003
14.894
+3.029
25.53%
jan 1, 2004
11.268
-3.626
-24.35%
jan 1, 2005
1.316
-9.952
-88.32%
jan 1, 2006
7.407
+6.092
462.96%
jan 1, 2007
6.122
-1.285
-17.35%
jan 1, 2008
6.731
+0.608
9.94%
jan 1, 2009
6.061
-0.67
-9.96%
jan 1, 2010
6.623
+0.562
9.27%
jan 1, 2011
6.18
-0.443
-6.69%
jan 1, 2012
5.419
-0.761
-12.32%
jan 1, 2013
5.752
+0.333
6.15%
jan 1, 2014
5.983
+0.231
4.01%
Ranking of countries by current statistics by years


Comments: