29
/
en
AIzaSyAYiBZKx7MnpbEhh9jyipgxe19OcubqV5w
April 1, 2024
36418
IBRD only
IBD
false
2
1
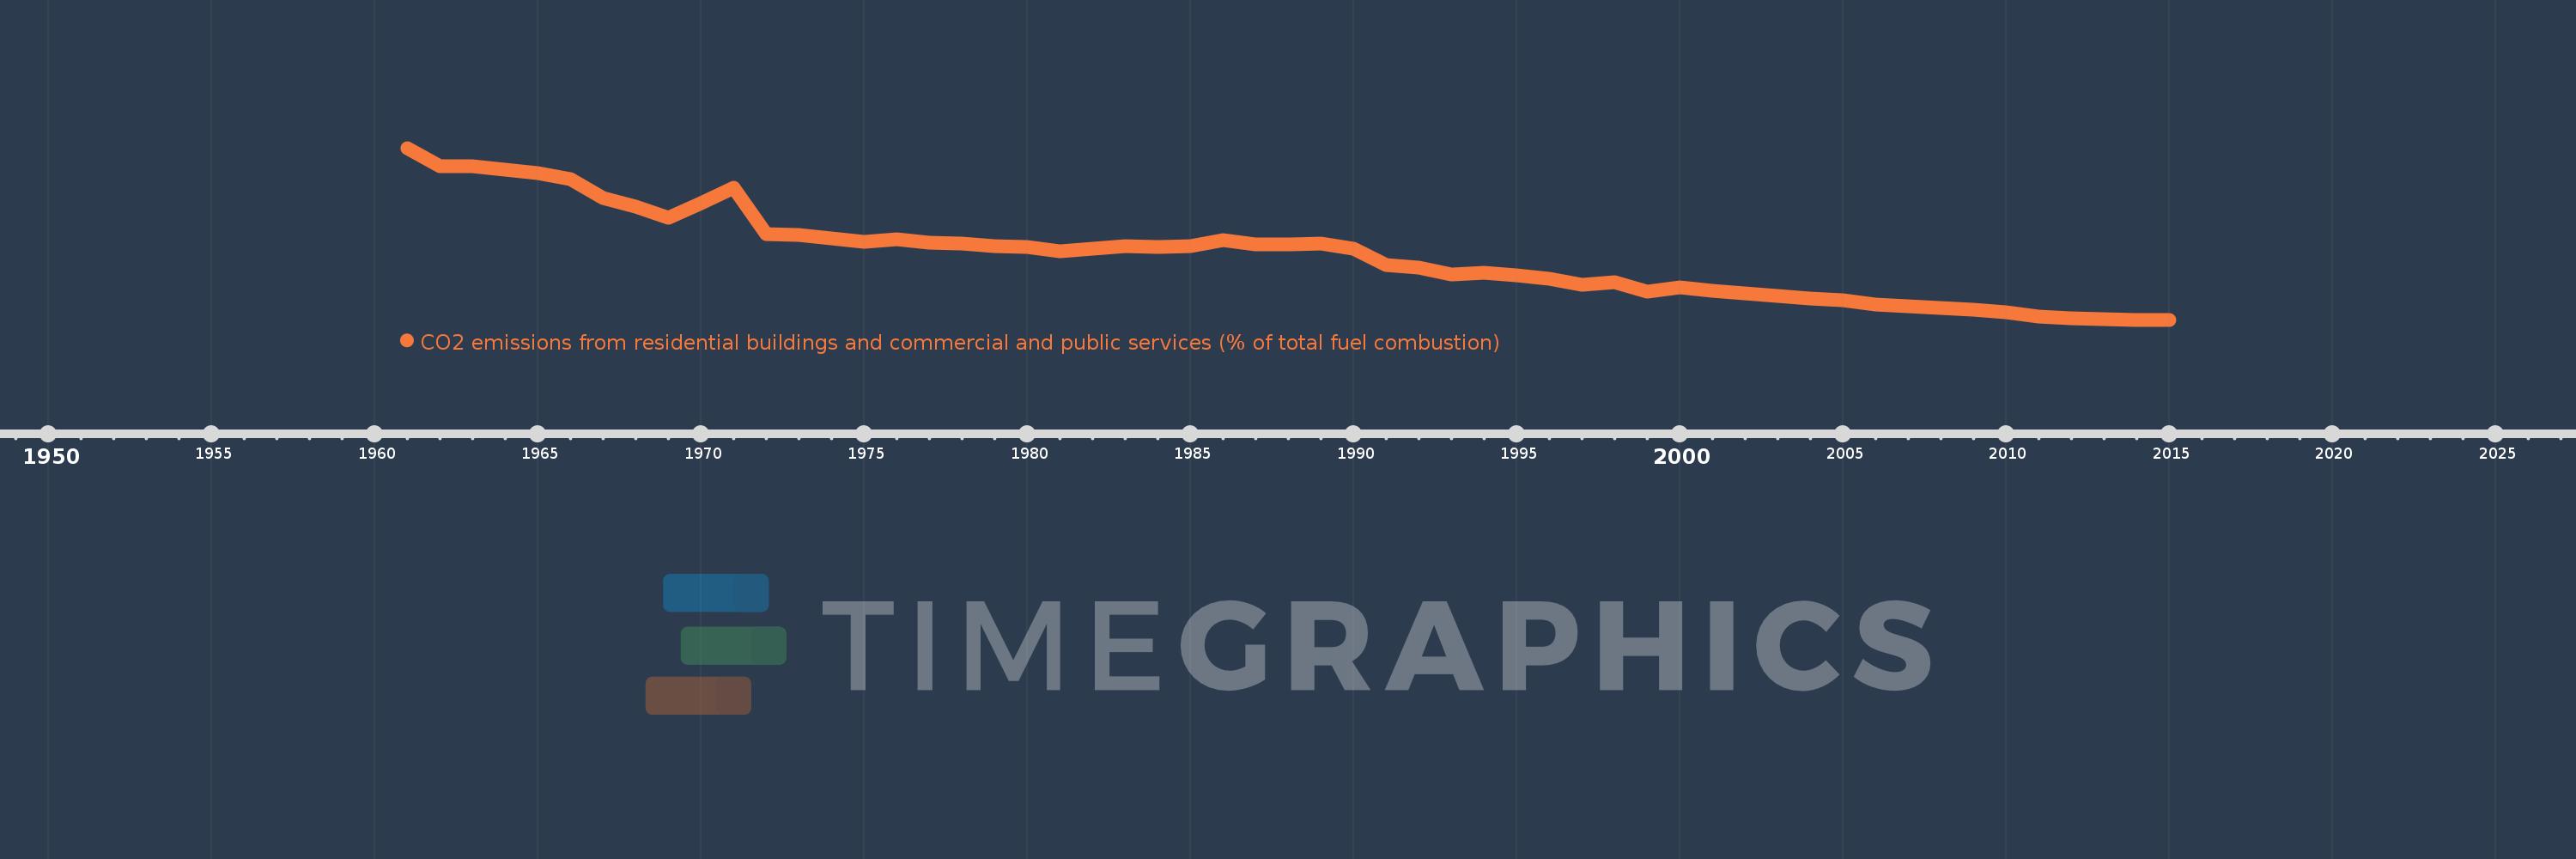
CO2 emissions from residential buildings and commercial and public services (% of total fuel combustion)
2015,2014,2013,2012,2011,2010,2009,2008,2007,2006,2005,2004,2003,2002,2001,2000,1999,1998,1997,1996,1995,1994,1993,1992,1991,1990,1989,1988,1987,1986,1985,1984,1983,1982,1981,1980,1979,1978,1977,1976,1975,1974,1973,1972,1971,1970,1969,1968,1967,1966,1965,1964,1963,1962,1961
This statistics in other country:
AlbaniaAlgeriaAngolaArab WorldArgentinaArmeniaAustraliaAustriaAzerbaijanBahrainBangladeshBelarusBelgiumBeninBoliviaBosnia and HerzegovinaBotswanaBrazilBrunei DarussalamBulgariaCambodiaCameroonCanadaCaribbean small statesCentral Europe and the BalticsChileChinaColombiaCongo, Dem. Rep.Congo, Rep.Costa RicaCote d'IvoireCroatiaCubaCuracaoCyprusCzech RepublicDenmarkDominican RepublicEarly-demographic dividendEast Asia & PacificEast Asia & Pacific (excluding high income)East Asia & Pacific (IDA & IBRD countries)EcuadorEgypt, Arab Rep.El SalvadorEritreaEstoniaEthiopiaEuro areaEurope & Central AsiaEurope & Central Asia (excluding high income)Europe & Central Asia (IDA & IBRD countries)European UnionFinlandFragile and conflict affected situationsFranceGabonGeorgiaGermanyGhanaGibraltarGreeceGuatemalaHaitiHeavily indebted poor countries (HIPC)High incomeHondurasHong Kong SAR, ChinaHungaryIBRD onlyIcelandIDA & IBRD totalIDA blendIDA onlyIDA totalIndiaIndonesiaIran, Islamic Rep.IraqIrelandIsraelItalyJamaicaJapanJordanKazakhstanKenyaKorea, Dem. People’s Rep.Korea, Rep.KosovoKuwaitKyrgyz RepublicLate-demographic dividendLatin America & Caribbean Latin America & Caribbean (excluding high income)Latin America & the Caribbean (IDA & IBRD countries)LatviaLeast developed countries: UN classificationLebanonLibyaLithuaniaLow & middle incomeLow incomeLower middle incomeLuxembourgMacedonia, FYRMalaysiaMaltaMauritiusMexicoMiddle East & North AfricaMiddle East & North Africa (excluding high income)Middle East & North Africa (IDA & IBRD countries)Middle incomeMoldovaMongoliaMontenegroMoroccoMozambiqueMyanmarNamibiaNepalNetherlandsNew ZealandNicaraguaNigerNigeriaNorth AmericaNorwayOECD membersOmanOther small statesPakistanPanamaParaguayPeruPhilippinesPolandPortugalPost-demographic dividendPre-demographic dividendQatarRomaniaRussian FederationSaudi ArabiaSenegalSerbiaSingaporeSlovak RepublicSloveniaSmall statesSouth AfricaSouth AsiaSouth Asia (IDA & IBRD)South SudanSpainSri LankaSub-Saharan Africa Sub-Saharan Africa (excluding high income)Sub-Saharan Africa (IDA & IBRD countries)SudanSwedenSwitzerlandSyrian Arab RepublicTajikistanTanzaniaThailandTogoTrinidad and TobagoTunisiaTurkeyTurkmenistanUkraineUnited Arab EmiratesUnited KingdomUnited StatesUpper middle incomeUruguayUzbekistanVenezuela, RBVietnamWorldYemen, Rep.ZambiaZimbabwe Timeline:
This timeline shows a graph from 1961 to 2015 of IBRD only. No data until 1960. Number of actual observations by date: 55.
Source name:
World Development Indicators
Source organization:
IEA Statistics © OECD/IEA 2014 (http://www.iea.org/stats/index.asp), subject to https://www.iea.org/t&c/termsandconditions/
Categories, topics:
Environment
Last updated:
apr 23, 2017
Indicators value changes by year
Maximum:
24.544
jan 1, 1961
At the date of observation
Value
Absolute change
Change from previous value
jan 1, 1961
24.544
+24.544
0.0%
jan 1, 1962
22.694
-1.85
-7.54%
jan 1, 1963
22.667
-0.027
-0.12%
jan 1, 1964
22.309
-0.358
-1.58%
jan 1, 1965
21.993
-0.316
-1.42%
jan 1, 1966
21.352
-0.641
-2.91%
jan 1, 1967
19.458
-1.893
-8.87%
jan 1, 1968
18.51
-0.948
-4.87%
jan 1, 1969
17.386
-1.125
-6.08%
jan 1, 1970
18.914
+1.528
8.79%
jan 1, 1971
20.459
+1.546
8.17%
jan 1, 1972
15.704
-4.756
-23.24%
jan 1, 1973
15.609
-0.095
-0.61%
jan 1, 1974
15.256
-0.353
-2.26%
jan 1, 1975
14.984
-0.272
-1.78%
jan 1, 1976
15.235
+0.251
1.68%
jan 1, 1977
14.833
-0.402
-2.64%
jan 1, 1978
14.777
-0.056
-0.38%
jan 1, 1979
14.545
-0.232
-1.57%
jan 1, 1980
14.412
-0.133
-0.92%
jan 1, 1981
13.963
-0.449
-3.12%
jan 1, 1982
14.267
+0.304
2.18%
jan 1, 1983
14.498
+0.231
1.62%
jan 1, 1984
14.443
-0.055
-0.38%
jan 1, 1985
14.483
+0.04
0.28%
jan 1, 1986
15.087
+0.604
4.17%
jan 1, 1987
14.686
-0.401
-2.66%
jan 1, 1988
14.697
+0.011
0.07%
jan 1, 1989
14.795
+0.098
0.67%
jan 1, 1990
14.228
-0.567
-3.83%
jan 1, 1991
12.607
-1.621
-11.39%
jan 1, 1992
12.316
-0.291
-2.3%
jan 1, 1993
11.608
-0.708
-5.75%
jan 1, 1994
11.811
+0.203
1.75%
jan 1, 1995
11.489
-0.322
-2.73%
jan 1, 1996
11.2
-0.289
-2.51%
jan 1, 1997
10.563
-0.637
-5.69%
jan 1, 1998
10.852
+0.29
2.74%
jan 1, 1999
9.848
-1.004
-9.25%
jan 1, 2000
10.321
+0.473
4.8%
jan 1, 2001
9.9
-0.421
-4.08%
jan 1, 2002
9.682
-0.219
-2.21%
jan 1, 2003
9.45
-0.232
-2.4%
jan 1, 2004
9.142
-0.307
-3.25%
jan 1, 2005
8.942
-0.2
-2.19%
jan 1, 2006
8.537
-0.405
-4.53%
jan 1, 2007
8.37
-0.167
-1.95%
jan 1, 2008
8.152
-0.218
-2.6%
jan 1, 2009
8.021
-0.131
-1.61%
jan 1, 2010
7.747
-0.275
-3.42%
jan 1, 2011
7.328
-0.418
-5.4%
jan 1, 2012
7.143
-0.185
-2.53%
jan 1, 2013
7.043
-0.1
-1.4%
jan 1, 2014
6.999
-0.044
-0.63%
jan 1, 2015
6.984
-0.015
-0.21%
Ranking of countries by current statistics by years


Comments: