29
/
en
AIzaSyAYiBZKx7MnpbEhh9jyipgxe19OcubqV5w
April 1, 2024
23957
Arab World
ARB
false
2
1
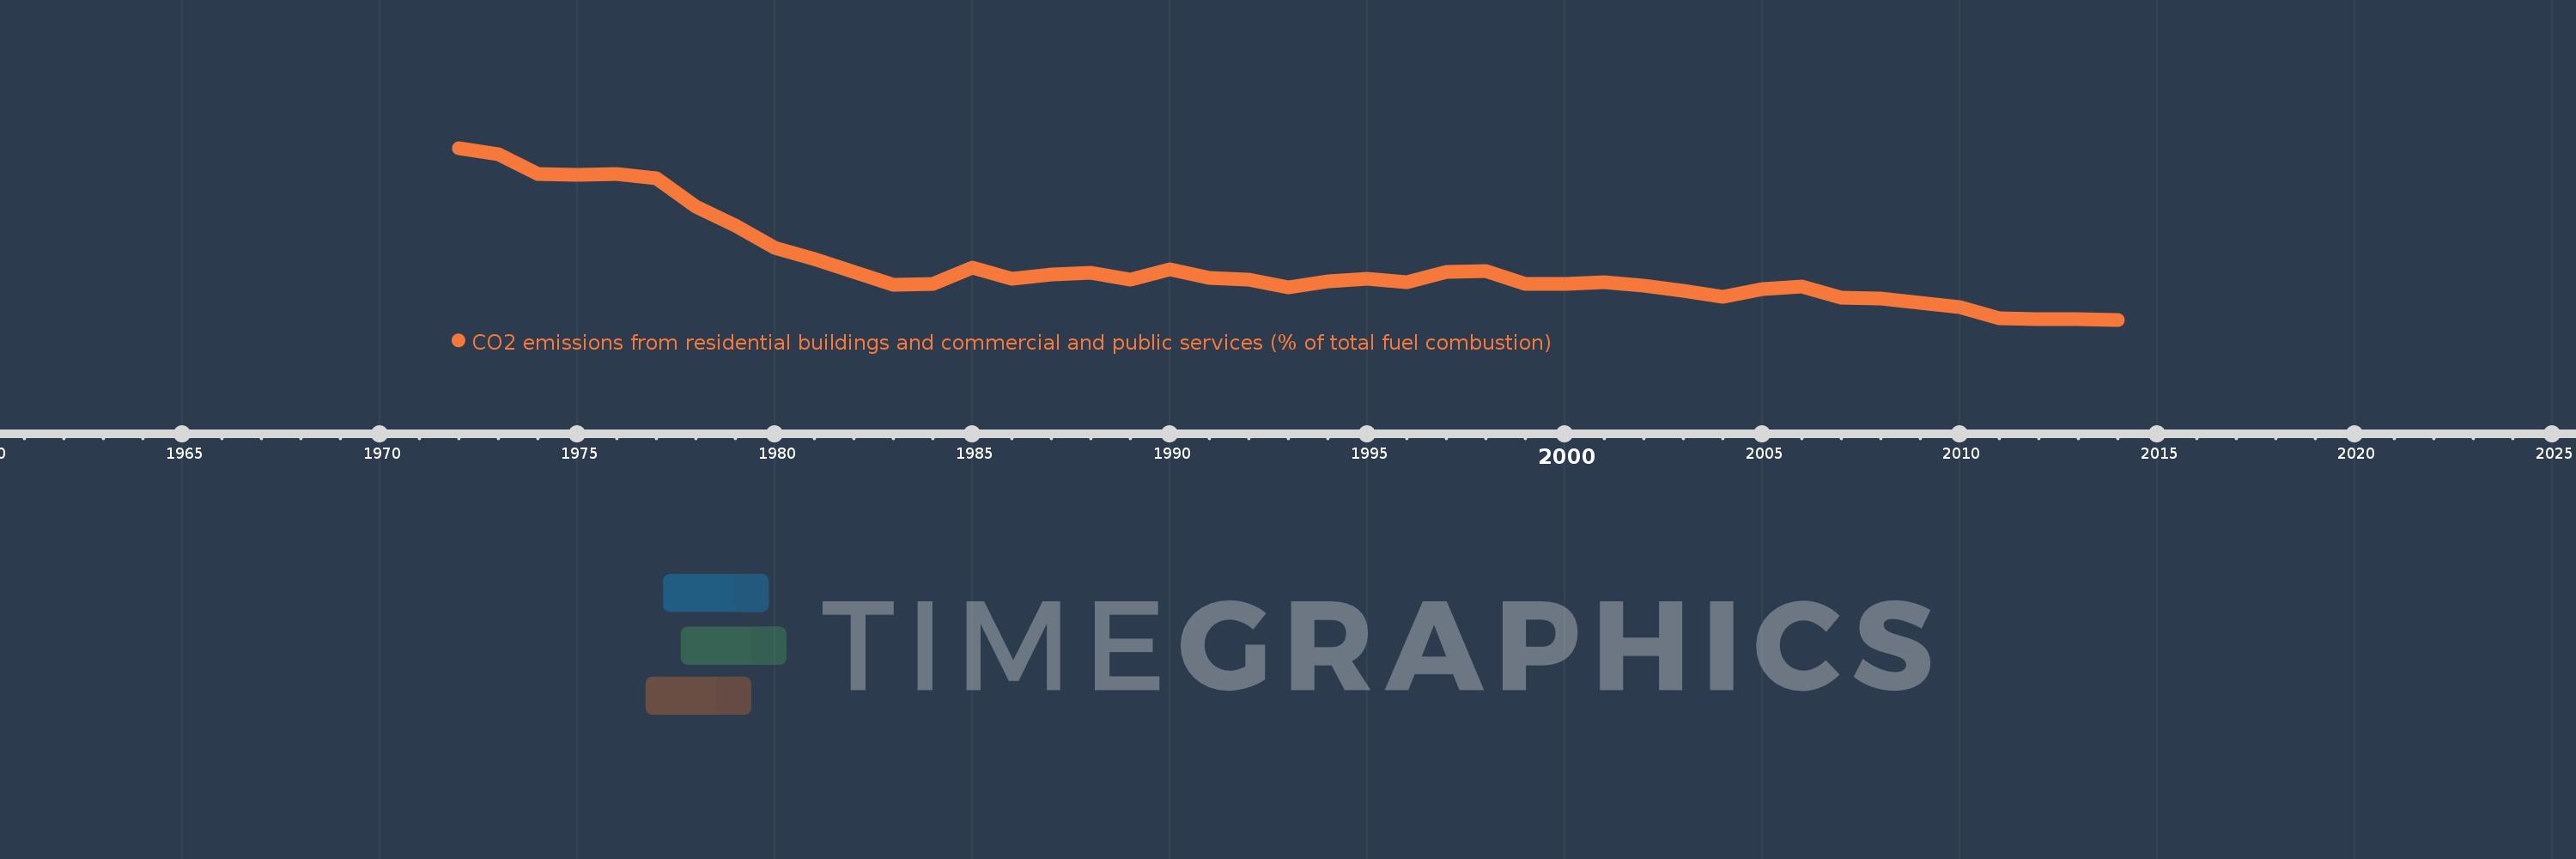
CO2 emissions from residential buildings and commercial and public services (% of total fuel combustion)
2014,2013,2012,2011,2010,2009,2008,2007,2006,2005,2004,2003,2002,2001,2000,1999,1998,1997,1996,1995,1994,1993,1992,1991,1990,1989,1988,1987,1986,1985,1984,1983,1982,1981,1980,1979,1978,1977,1976,1975,1974,1973,1972
This statistics in other country:
AlbaniaAlgeriaAngolaArab WorldArgentinaArmeniaAustraliaAustriaAzerbaijanBahrainBangladeshBelarusBelgiumBeninBoliviaBosnia and HerzegovinaBotswanaBrazilBrunei DarussalamBulgariaCambodiaCameroonCanadaCaribbean small statesCentral Europe and the BalticsChileChinaColombiaCongo, Dem. Rep.Congo, Rep.Costa RicaCote d'IvoireCroatiaCubaCuracaoCyprusCzech RepublicDenmarkDominican RepublicEarly-demographic dividendEast Asia & PacificEast Asia & Pacific (excluding high income)East Asia & Pacific (IDA & IBRD countries)EcuadorEgypt, Arab Rep.El SalvadorEritreaEstoniaEthiopiaEuro areaEurope & Central AsiaEurope & Central Asia (excluding high income)Europe & Central Asia (IDA & IBRD countries)European UnionFinlandFragile and conflict affected situationsFranceGabonGeorgiaGermanyGhanaGibraltarGreeceGuatemalaHaitiHeavily indebted poor countries (HIPC)High incomeHondurasHong Kong SAR, ChinaHungaryIBRD onlyIcelandIDA & IBRD totalIDA blendIDA onlyIDA totalIndiaIndonesiaIran, Islamic Rep.IraqIrelandIsraelItalyJamaicaJapanJordanKazakhstanKenyaKorea, Dem. People’s Rep.Korea, Rep.KosovoKuwaitKyrgyz RepublicLate-demographic dividendLatin America & Caribbean Latin America & Caribbean (excluding high income)Latin America & the Caribbean (IDA & IBRD countries)LatviaLeast developed countries: UN classificationLebanonLibyaLithuaniaLow & middle incomeLow incomeLower middle incomeLuxembourgMacedonia, FYRMalaysiaMaltaMauritiusMexicoMiddle East & North AfricaMiddle East & North Africa (excluding high income)Middle East & North Africa (IDA & IBRD countries)Middle incomeMoldovaMongoliaMontenegroMoroccoMozambiqueMyanmarNamibiaNepalNetherlandsNew ZealandNicaraguaNigerNigeriaNorth AmericaNorwayOECD membersOmanOther small statesPakistanPanamaParaguayPeruPhilippinesPolandPortugalPost-demographic dividendPre-demographic dividendQatarRomaniaRussian FederationSaudi ArabiaSenegalSerbiaSingaporeSlovak RepublicSloveniaSmall statesSouth AfricaSouth AsiaSouth Asia (IDA & IBRD)South SudanSpainSri LankaSub-Saharan Africa Sub-Saharan Africa (excluding high income)Sub-Saharan Africa (IDA & IBRD countries)SudanSwedenSwitzerlandSyrian Arab RepublicTajikistanTanzaniaThailandTogoTrinidad and TobagoTunisiaTurkeyTurkmenistanUkraineUnited Arab EmiratesUnited KingdomUnited StatesUpper middle incomeUruguayUzbekistanVenezuela, RBVietnamWorldYemen, Rep.ZambiaZimbabwe Timeline:
This timeline shows a graph from 1972 to 2014 of Arab World. No data until 1971. Number of actual observations by date: 43.
Source name:
World Development Indicators
Source organization:
IEA Statistics © OECD/IEA 2014 (http://www.iea.org/stats/index.asp), subject to https://www.iea.org/t&c/termsandconditions/
Categories, topics:
Environment
Last updated:
apr 23, 2017
Indicators value changes by year
Maximum:
11.784
jan 1, 1972
At the date of observation
Value
Absolute change
Change from previous value
jan 1, 1972
11.784
+11.784
0.0%
jan 1, 1973
11.527
-0.256
-2.18%
jan 1, 1974
10.719
-0.808
-7.01%
jan 1, 1975
10.664
-0.054
-0.51%
jan 1, 1976
10.702
+0.038
0.35%
jan 1, 1977
10.508
-0.194
-1.82%
jan 1, 1978
9.337
-1.171
-11.14%
jan 1, 1979
8.561
-0.776
-8.31%
jan 1, 1980
7.64
-0.921
-10.76%
jan 1, 1981
7.175
-0.465
-6.09%
jan 1, 1982
6.648
-0.528
-7.36%
jan 1, 1983
6.112
-0.536
-8.06%
jan 1, 1984
6.131
+0.019
0.31%
jan 1, 1985
6.815
+0.684
11.16%
jan 1, 1986
6.338
-0.477
-7.0%
jan 1, 1987
6.541
+0.204
3.21%
jan 1, 1988
6.613
+0.071
1.09%
jan 1, 1989
6.31
-0.302
-4.57%
jan 1, 1990
6.754
+0.444
7.03%
jan 1, 1991
6.376
-0.378
-5.6%
jan 1, 1992
6.322
-0.054
-0.85%
jan 1, 1993
5.99
-0.332
-5.25%
jan 1, 1994
6.252
+0.263
4.39%
jan 1, 1995
6.347
+0.095
1.52%
jan 1, 1996
6.21
-0.137
-2.16%
jan 1, 1997
6.617
+0.407
6.55%
jan 1, 1998
6.656
+0.039
0.6%
jan 1, 1999
6.15
-0.506
-7.6%
jan 1, 2000
6.149
-0.001
-0.02%
jan 1, 2001
6.199
+0.05
0.82%
jan 1, 2002
6.057
-0.142
-2.3%
jan 1, 2003
5.85
-0.207
-3.42%
jan 1, 2004
5.598
-0.252
-4.31%
jan 1, 2005
5.921
+0.323
5.77%
jan 1, 2006
6.042
+0.121
2.05%
jan 1, 2007
5.569
-0.473
-7.83%
jan 1, 2008
5.516
-0.053
-0.95%
jan 1, 2009
5.345
-0.171
-3.1%
jan 1, 2010
5.158
-0.187
-3.5%
jan 1, 2011
4.688
-0.469
-9.1%
jan 1, 2012
4.664
-0.025
-0.53%
jan 1, 2013
4.666
+0.002
0.04%
jan 1, 2014
4.644
-0.021
-0.46%
Ranking of countries by current statistics by years


Comments: