29
/
en
AIzaSyAYiBZKx7MnpbEhh9jyipgxe19OcubqV5w
April 1, 2024
64437
Albania
ALB
true
2
1
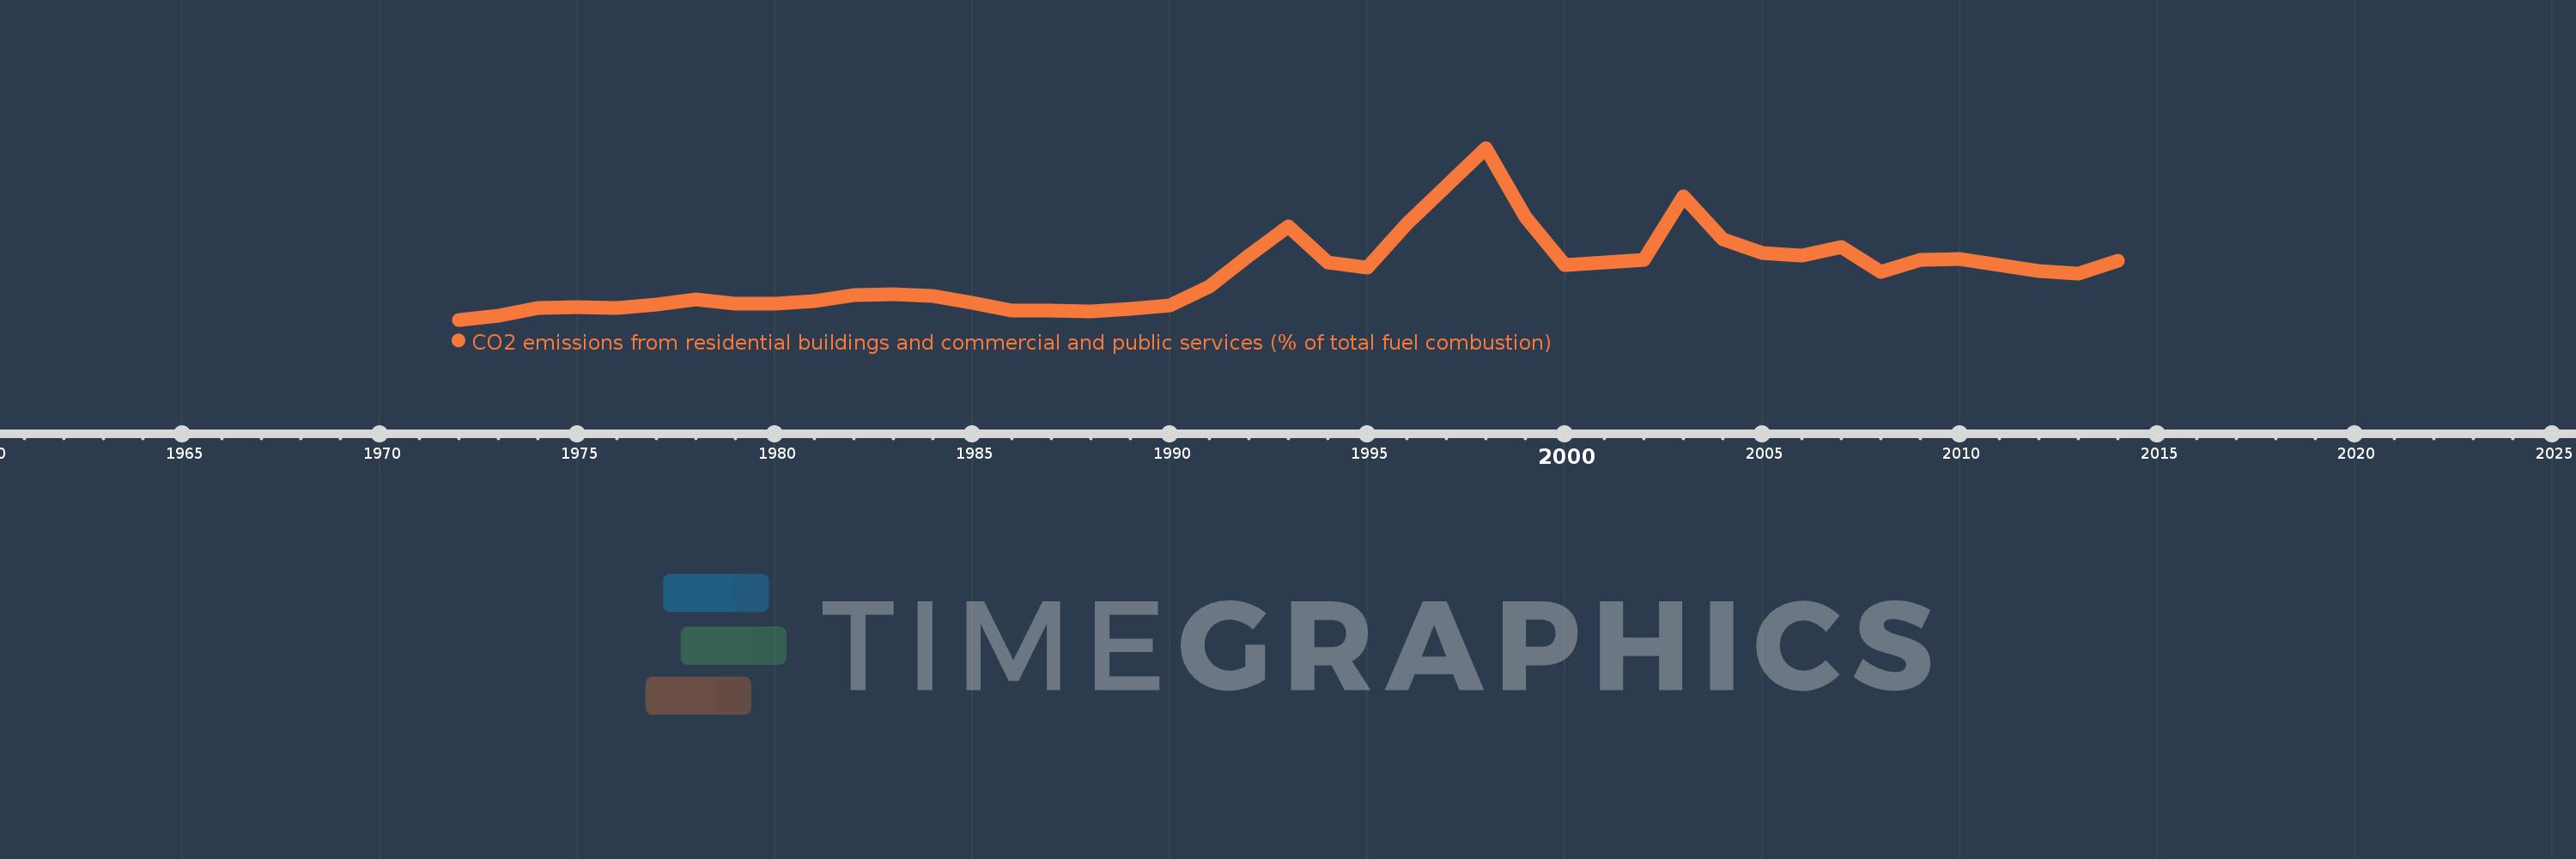
CO2 emissions from residential buildings and commercial and public services (% of total fuel combustion)
2014,2013,2012,2011,2010,2009,2008,2007,2006,2005,2004,2003,2002,2001,2000,1999,1998,1997,1996,1995,1994,1993,1992,1991,1990,1989,1988,1987,1986,1985,1984,1983,1982,1981,1980,1979,1978,1977,1976,1975,1974,1973,1972
This statistics in other country:
AlbaniaAlgeriaAngolaArab WorldArgentinaArmeniaAustraliaAustriaAzerbaijanBahrainBangladeshBelarusBelgiumBeninBoliviaBosnia and HerzegovinaBotswanaBrazilBrunei DarussalamBulgariaCambodiaCameroonCanadaCaribbean small statesCentral Europe and the BalticsChileChinaColombiaCongo, Dem. Rep.Congo, Rep.Costa RicaCote d'IvoireCroatiaCubaCuracaoCyprusCzech RepublicDenmarkDominican RepublicEarly-demographic dividendEast Asia & PacificEast Asia & Pacific (excluding high income)East Asia & Pacific (IDA & IBRD countries)EcuadorEgypt, Arab Rep.El SalvadorEritreaEstoniaEthiopiaEuro areaEurope & Central AsiaEurope & Central Asia (excluding high income)Europe & Central Asia (IDA & IBRD countries)European UnionFinlandFragile and conflict affected situationsFranceGabonGeorgiaGermanyGhanaGibraltarGreeceGuatemalaHaitiHeavily indebted poor countries (HIPC)High incomeHondurasHong Kong SAR, ChinaHungaryIBRD onlyIcelandIDA & IBRD totalIDA blendIDA onlyIDA totalIndiaIndonesiaIran, Islamic Rep.IraqIrelandIsraelItalyJamaicaJapanJordanKazakhstanKenyaKorea, Dem. People’s Rep.Korea, Rep.KosovoKuwaitKyrgyz RepublicLate-demographic dividendLatin America & Caribbean Latin America & Caribbean (excluding high income)Latin America & the Caribbean (IDA & IBRD countries)LatviaLeast developed countries: UN classificationLebanonLibyaLithuaniaLow & middle incomeLow incomeLower middle incomeLuxembourgMacedonia, FYRMalaysiaMaltaMauritiusMexicoMiddle East & North AfricaMiddle East & North Africa (excluding high income)Middle East & North Africa (IDA & IBRD countries)Middle incomeMoldovaMongoliaMontenegroMoroccoMozambiqueMyanmarNamibiaNepalNetherlandsNew ZealandNicaraguaNigerNigeriaNorth AmericaNorwayOECD membersOmanOther small statesPakistanPanamaParaguayPeruPhilippinesPolandPortugalPost-demographic dividendPre-demographic dividendQatarRomaniaRussian FederationSaudi ArabiaSenegalSerbiaSingaporeSlovak RepublicSloveniaSmall statesSouth AfricaSouth AsiaSouth Asia (IDA & IBRD)South SudanSpainSri LankaSub-Saharan Africa Sub-Saharan Africa (excluding high income)Sub-Saharan Africa (IDA & IBRD countries)SudanSwedenSwitzerlandSyrian Arab RepublicTajikistanTanzaniaThailandTogoTrinidad and TobagoTunisiaTurkeyTurkmenistanUkraineUnited Arab EmiratesUnited KingdomUnited StatesUpper middle incomeUruguayUzbekistanVenezuela, RBVietnamWorldYemen, Rep.ZambiaZimbabwe Timeline:
This timeline shows a graph from 1972 to 2014 of Albania. No data until 1971. Number of actual observations by date: 43.
Source name:
World Development Indicators
Source organization:
IEA Statistics © OECD/IEA 2014 (http://www.iea.org/stats/index.asp), subject to https://www.iea.org/t&c/termsandconditions/
Categories, topics:
Environment
Last updated:
apr 23, 2017
Indicators value changes by year
Maximum:
23.077
jan 1, 1998
At the date of observation
Value
Absolute change
Change from previous value
jan 1, 1972
1.295
+1.295
0.0%
jan 1, 1973
1.798
+0.502
38.79%
jan 1, 1974
2.806
+1.008
56.09%
jan 1, 1975
2.92
+0.114
4.05%
jan 1, 1976
2.765
-0.155
-5.3%
jan 1, 1977
3.205
+0.44
15.92%
jan 1, 1978
3.831
+0.626
19.52%
jan 1, 1979
3.381
-0.45
-11.74%
jan 1, 1980
3.284
-0.097
-2.88%
jan 1, 1981
3.671
+0.387
11.8%
jan 1, 1982
4.444
+0.773
21.07%
jan 1, 1983
4.583
+0.138
3.11%
jan 1, 1984
4.354
-0.228
-4.98%
jan 1, 1985
3.463
-0.892
-20.48%
jan 1, 1986
2.45
-1.013
-29.26%
jan 1, 1987
2.443
-0.007
-0.29%
jan 1, 1988
2.348
-0.094
-3.87%
jan 1, 1989
2.65
+0.302
12.86%
jan 1, 1990
3.07
+0.42
15.86%
jan 1, 1991
5.467
+2.397
78.08%
jan 1, 1992
9.449
+3.981
72.82%
jan 1, 1993
13.084
+3.635
38.47%
jan 1, 1994
8.586
-4.498
-34.38%
jan 1, 1995
7.882
-0.704
-8.2%
jan 1, 1996
13.514
+5.632
71.45%
jan 1, 1997
18.28
+4.766
35.27%
jan 1, 1998
23.077
+4.797
26.24%
jan 1, 1999
14.371
-8.706
-37.72%
jan 1, 2000
8.276
-6.095
-42.41%
jan 1, 2001
8.609
+0.333
4.03%
jan 1, 2002
8.833
+0.224
2.6%
jan 1, 2003
16.94
+8.107
91.78%
jan 1, 2004
11.518
-5.422
-32.0%
jan 1, 2005
9.726
-1.793
-15.56%
jan 1, 2006
9.424
-0.302
-3.1%
jan 1, 2007
10.554
+1.13
11.99%
jan 1, 2008
7.407
-3.147
-29.81%
jan 1, 2009
8.919
+1.512
20.41%
jan 1, 2010
9.041
+0.122
1.37%
jan 1, 2011
8.184
-0.857
-9.48%
jan 1, 2012
7.488
-0.696
-8.51%
jan 1, 2013
7.184
-0.304
-4.06%
jan 1, 2014
8.791
+1.607
22.37%
Ranking of countries by current statistics by years


Comments: