29
/
en
AIzaSyAYiBZKx7MnpbEhh9jyipgxe19OcubqV5w
April 1, 2024
160295
Israel
ISR
true
2
1
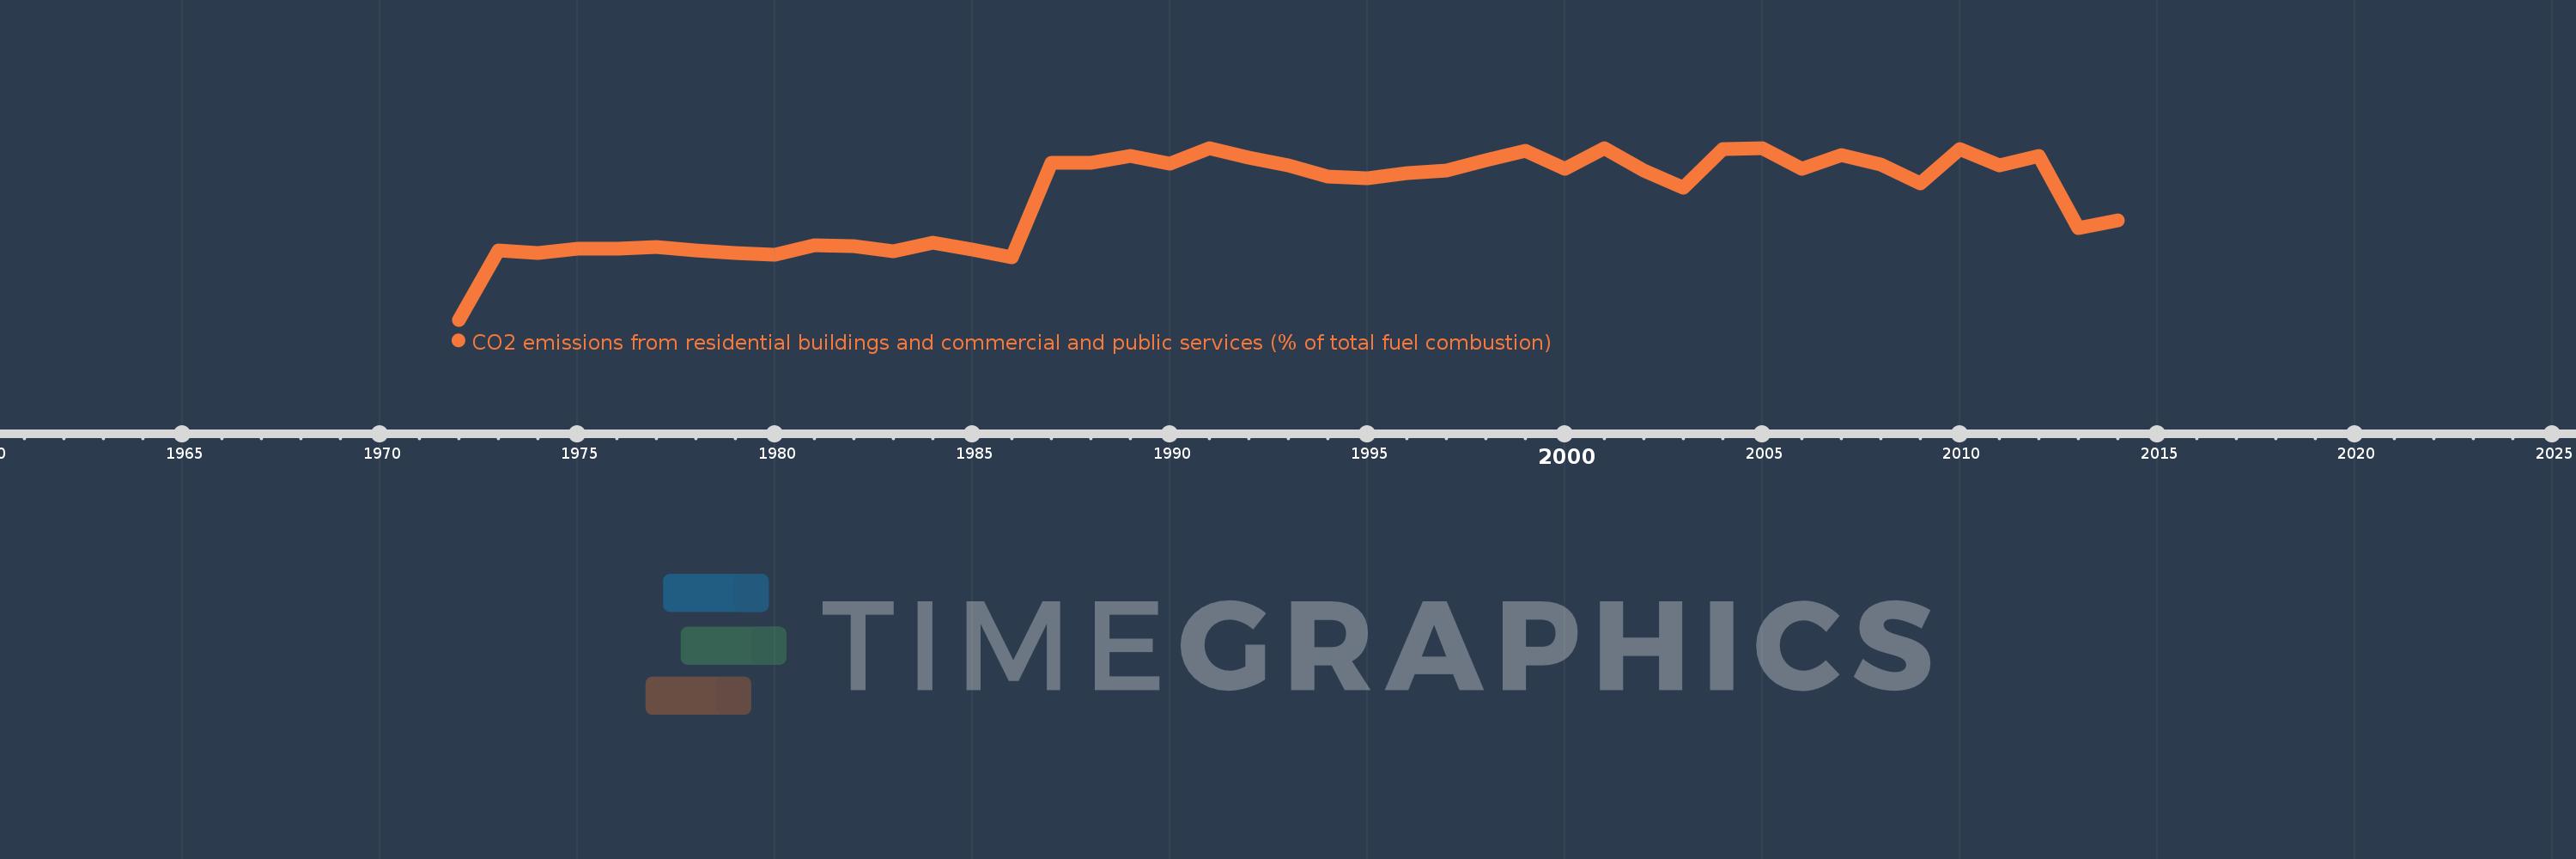
CO2 emissions from residential buildings and commercial and public services (% of total fuel combustion)
2014,2013,2012,2011,2010,2009,2008,2007,2006,2005,2004,2003,2002,2001,2000,1999,1998,1997,1996,1995,1994,1993,1992,1991,1990,1989,1988,1987,1986,1985,1984,1983,1982,1981,1980,1979,1978,1977,1976,1975,1974,1973,1972
This statistics in other country:
AlbaniaAlgeriaAngolaArab WorldArgentinaArmeniaAustraliaAustriaAzerbaijanBahrainBangladeshBelarusBelgiumBeninBoliviaBosnia and HerzegovinaBotswanaBrazilBrunei DarussalamBulgariaCambodiaCameroonCanadaCaribbean small statesCentral Europe and the BalticsChileChinaColombiaCongo, Dem. Rep.Congo, Rep.Costa RicaCote d'IvoireCroatiaCubaCuracaoCyprusCzech RepublicDenmarkDominican RepublicEarly-demographic dividendEast Asia & PacificEast Asia & Pacific (excluding high income)East Asia & Pacific (IDA & IBRD countries)EcuadorEgypt, Arab Rep.El SalvadorEritreaEstoniaEthiopiaEuro areaEurope & Central AsiaEurope & Central Asia (excluding high income)Europe & Central Asia (IDA & IBRD countries)European UnionFinlandFragile and conflict affected situationsFranceGabonGeorgiaGermanyGhanaGibraltarGreeceGuatemalaHaitiHeavily indebted poor countries (HIPC)High incomeHondurasHong Kong SAR, ChinaHungaryIBRD onlyIcelandIDA & IBRD totalIDA blendIDA onlyIDA totalIndiaIndonesiaIran, Islamic Rep.IraqIrelandIsraelItalyJamaicaJapanJordanKazakhstanKenyaKorea, Dem. People’s Rep.Korea, Rep.KosovoKuwaitKyrgyz RepublicLate-demographic dividendLatin America & Caribbean Latin America & Caribbean (excluding high income)Latin America & the Caribbean (IDA & IBRD countries)LatviaLeast developed countries: UN classificationLebanonLibyaLithuaniaLow & middle incomeLow incomeLower middle incomeLuxembourgMacedonia, FYRMalaysiaMaltaMauritiusMexicoMiddle East & North AfricaMiddle East & North Africa (excluding high income)Middle East & North Africa (IDA & IBRD countries)Middle incomeMoldovaMongoliaMontenegroMoroccoMozambiqueMyanmarNamibiaNepalNetherlandsNew ZealandNicaraguaNigerNigeriaNorth AmericaNorwayOECD membersOmanOther small statesPakistanPanamaParaguayPeruPhilippinesPolandPortugalPost-demographic dividendPre-demographic dividendQatarRomaniaRussian FederationSaudi ArabiaSenegalSerbiaSingaporeSlovak RepublicSloveniaSmall statesSouth AfricaSouth AsiaSouth Asia (IDA & IBRD)South SudanSpainSri LankaSub-Saharan Africa Sub-Saharan Africa (excluding high income)Sub-Saharan Africa (IDA & IBRD countries)SudanSwedenSwitzerlandSyrian Arab RepublicTajikistanTanzaniaThailandTogoTrinidad and TobagoTunisiaTurkeyTurkmenistanUkraineUnited Arab EmiratesUnited KingdomUnited StatesUpper middle incomeUruguayUzbekistanVenezuela, RBVietnamWorldYemen, Rep.ZambiaZimbabwe Timeline:
This timeline shows a graph from 1972 to 2014 of Israel. No data until 1971. Number of actual observations by date: 43.
Source name:
World Development Indicators
Source organization:
IEA Statistics © OECD/IEA 2014 (http://www.iea.org/stats/index.asp), subject to https://www.iea.org/t&c/termsandconditions/
Categories, topics:
Environment
Last updated:
apr 23, 2017
Indicators value changes by year
At the date of observation
Value
Absolute change
Change from previous value
jan 1, 1973
1.733
+1.733
%
jan 1, 1974
1.661
-0.071
-4.11%
jan 1, 1975
1.77
+0.109
6.54%
jan 1, 1976
1.767
-0.003
-0.15%
jan 1, 1977
1.82
+0.053
3.01%
jan 1, 1978
1.726
-0.094
-5.18%
jan 1, 1979
1.668
-0.058
-3.34%
jan 1, 1980
1.632
-0.037
-2.21%
jan 1, 1981
1.857
+0.225
13.8%
jan 1, 1982
1.833
-0.024
-1.28%
jan 1, 1983
1.72
-0.113
-6.16%
jan 1, 1984
1.928
+0.208
12.11%
jan 1, 1985
1.764
-0.164
-8.5%
jan 1, 1986
1.563
-0.201
-11.41%
jan 1, 1987
3.93
+2.366
151.39%
jan 1, 1988
3.932
+0.003
0.07%
jan 1, 1989
4.106
+0.173
4.4%
jan 1, 1990
3.912
-0.193
-4.71%
jan 1, 1991
4.297
+0.385
9.84%
jan 1, 1992
4.052
-0.246
-5.72%
jan 1, 1993
3.854
-0.198
-4.88%
jan 1, 1994
3.586
-0.268
-6.95%
jan 1, 1995
3.536
-0.05
-1.38%
jan 1, 1996
3.677
+0.141
3.98%
jan 1, 1997
3.741
+0.063
1.72%
jan 1, 1998
3.981
+0.24
6.41%
jan 1, 1999
4.218
+0.238
5.97%
jan 1, 2000
3.767
-0.451
-10.69%
jan 1, 2001
4.286
+0.519
13.77%
jan 1, 2002
3.742
-0.544
-12.69%
jan 1, 2003
3.308
-0.434
-11.6%
jan 1, 2004
4.279
+0.971
29.36%
jan 1, 2005
4.299
+0.02
0.47%
jan 1, 2006
3.776
-0.523
-12.17%
jan 1, 2007
4.129
+0.353
9.34%
jan 1, 2008
3.89
-0.239
-5.78%
jan 1, 2009
3.412
-0.478
-12.29%
jan 1, 2010
4.276
+0.864
25.32%
jan 1, 2011
3.873
-0.404
-9.44%
jan 1, 2012
4.089
+0.216
5.59%
jan 1, 2013
2.3
-1.789
-43.74%
jan 1, 2014
2.479
+0.179
7.77%
Ranking of countries by current statistics by years


Comments: