29
/
en
AIzaSyAYiBZKx7MnpbEhh9jyipgxe19OcubqV5w
April 1, 2024
51722
North America
NAC
false
2
1
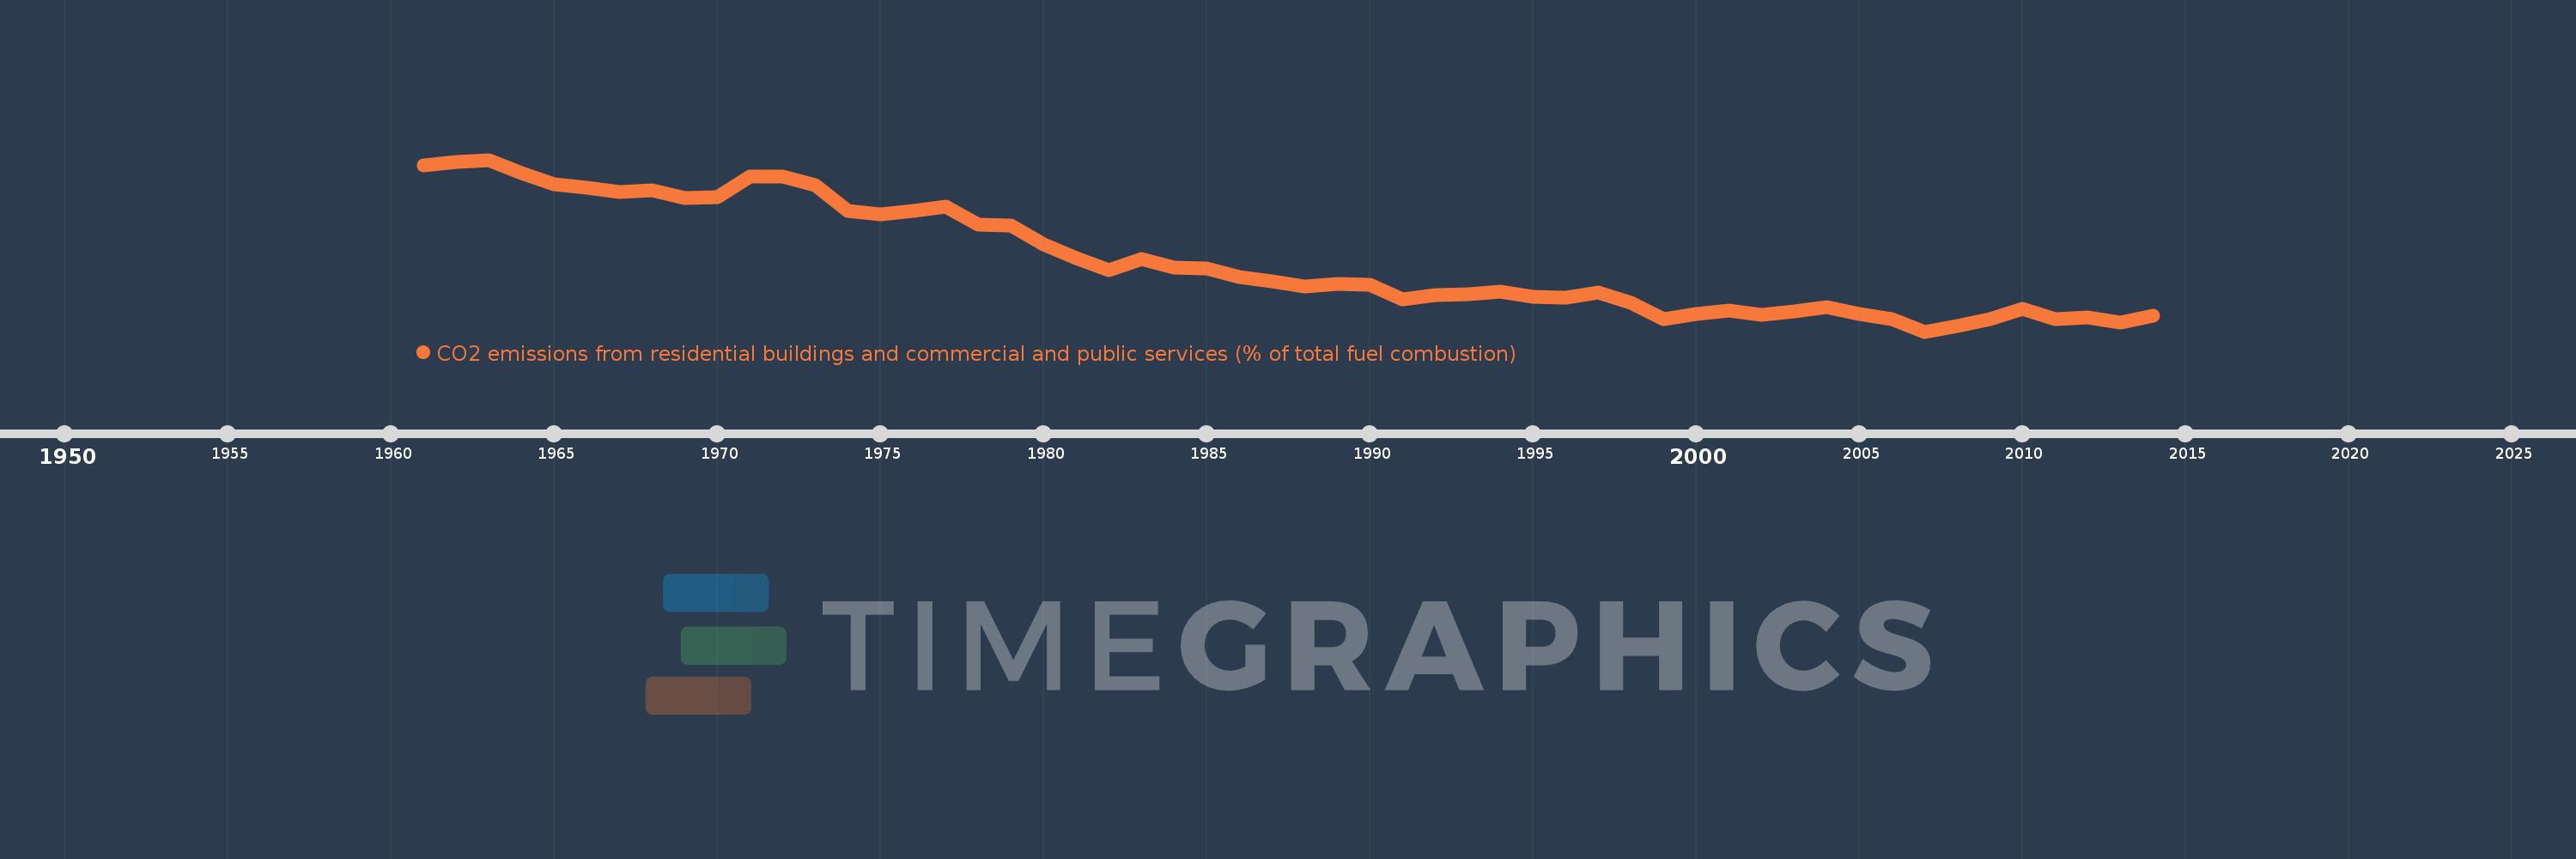
CO2 emissions from residential buildings and commercial and public services (% of total fuel combustion)
2014,2013,2012,2011,2010,2009,2008,2007,2006,2005,2004,2003,2002,2001,2000,1999,1998,1997,1996,1995,1994,1993,1992,1991,1990,1989,1988,1987,1986,1985,1984,1983,1982,1981,1980,1979,1978,1977,1976,1975,1974,1973,1972,1971,1970,1969,1968,1967,1966,1965,1964,1963,1962,1961
This statistics in other country:
AlbaniaAlgeriaAngolaArab WorldArgentinaArmeniaAustraliaAustriaAzerbaijanBahrainBangladeshBelarusBelgiumBeninBoliviaBosnia and HerzegovinaBotswanaBrazilBrunei DarussalamBulgariaCambodiaCameroonCanadaCaribbean small statesCentral Europe and the BalticsChileChinaColombiaCongo, Dem. Rep.Congo, Rep.Costa RicaCote d'IvoireCroatiaCubaCuracaoCyprusCzech RepublicDenmarkDominican RepublicEarly-demographic dividendEast Asia & PacificEast Asia & Pacific (excluding high income)East Asia & Pacific (IDA & IBRD countries)EcuadorEgypt, Arab Rep.El SalvadorEritreaEstoniaEthiopiaEuro areaEurope & Central AsiaEurope & Central Asia (excluding high income)Europe & Central Asia (IDA & IBRD countries)European UnionFinlandFragile and conflict affected situationsFranceGabonGeorgiaGermanyGhanaGibraltarGreeceGuatemalaHaitiHeavily indebted poor countries (HIPC)High incomeHondurasHong Kong SAR, ChinaHungaryIBRD onlyIcelandIDA & IBRD totalIDA blendIDA onlyIDA totalIndiaIndonesiaIran, Islamic Rep.IraqIrelandIsraelItalyJamaicaJapanJordanKazakhstanKenyaKorea, Dem. People’s Rep.Korea, Rep.KosovoKuwaitKyrgyz RepublicLate-demographic dividendLatin America & Caribbean Latin America & Caribbean (excluding high income)Latin America & the Caribbean (IDA & IBRD countries)LatviaLeast developed countries: UN classificationLebanonLibyaLithuaniaLow & middle incomeLow incomeLower middle incomeLuxembourgMacedonia, FYRMalaysiaMaltaMauritiusMexicoMiddle East & North AfricaMiddle East & North Africa (excluding high income)Middle East & North Africa (IDA & IBRD countries)Middle incomeMoldovaMongoliaMontenegroMoroccoMozambiqueMyanmarNamibiaNepalNetherlandsNew ZealandNicaraguaNigerNigeriaNorth AmericaNorwayOECD membersOmanOther small statesPakistanPanamaParaguayPeruPhilippinesPolandPortugalPost-demographic dividendPre-demographic dividendQatarRomaniaRussian FederationSaudi ArabiaSenegalSerbiaSingaporeSlovak RepublicSloveniaSmall statesSouth AfricaSouth AsiaSouth Asia (IDA & IBRD)South SudanSpainSri LankaSub-Saharan Africa Sub-Saharan Africa (excluding high income)Sub-Saharan Africa (IDA & IBRD countries)SudanSwedenSwitzerlandSyrian Arab RepublicTajikistanTanzaniaThailandTogoTrinidad and TobagoTunisiaTurkeyTurkmenistanUkraineUnited Arab EmiratesUnited KingdomUnited StatesUpper middle incomeUruguayUzbekistanVenezuela, RBVietnamWorldYemen, Rep.ZambiaZimbabwe Timeline:
This timeline shows a graph from 1961 to 2014 of North America. No data until 1960. Number of actual observations by date: 54.
Source name:
World Development Indicators
Source organization:
IEA Statistics © OECD/IEA 2014 (http://www.iea.org/stats/index.asp), subject to https://www.iea.org/t&c/termsandconditions/
Categories, topics:
Environment
Last updated:
apr 23, 2017
Indicators value changes by year
Maximum:
20.776
jan 1, 1963
At the date of observation
Value
Absolute change
Change from previous value
jan 1, 1961
20.398
+20.398
0.0%
jan 1, 1962
20.634
+0.236
1.16%
jan 1, 1963
20.776
+0.143
0.69%
jan 1, 1964
19.895
-0.881
-4.24%
jan 1, 1965
19.23
-0.666
-3.35%
jan 1, 1966
18.987
-0.242
-1.26%
jan 1, 1967
18.721
-0.266
-1.4%
jan 1, 1968
18.803
+0.082
0.44%
jan 1, 1969
18.3
-0.503
-2.68%
jan 1, 1970
18.382
+0.082
0.45%
jan 1, 1971
19.726
+1.344
7.31%
jan 1, 1972
19.714
-0.012
-0.06%
jan 1, 1973
19.135
-0.579
-2.94%
jan 1, 1974
17.523
-1.612
-8.42%
jan 1, 1975
17.251
-0.271
-1.55%
jan 1, 1976
17.512
+0.261
1.51%
jan 1, 1977
17.774
+0.262
1.5%
jan 1, 1978
16.618
-1.157
-6.51%
jan 1, 1979
16.542
-0.076
-0.46%
jan 1, 1980
15.336
-1.206
-7.29%
jan 1, 1981
14.459
-0.877
-5.72%
jan 1, 1982
13.696
-0.763
-5.28%
jan 1, 1983
14.431
+0.735
5.37%
jan 1, 1984
13.881
-0.549
-3.8%
jan 1, 1985
13.797
-0.085
-0.61%
jan 1, 1986
13.254
-0.543
-3.93%
jan 1, 1987
13.004
-0.25
-1.89%
jan 1, 1988
12.661
-0.343
-2.64%
jan 1, 1989
12.825
+0.164
1.29%
jan 1, 1990
12.746
-0.078
-0.61%
jan 1, 1991
11.844
-0.902
-7.08%
jan 1, 1992
12.103
+0.259
2.19%
jan 1, 1993
12.131
+0.028
0.23%
jan 1, 1994
12.325
+0.194
1.6%
jan 1, 1995
11.972
-0.352
-2.86%
jan 1, 1996
11.915
-0.057
-0.48%
jan 1, 1997
12.288
+0.372
3.12%
jan 1, 1998
11.598
-0.689
-5.61%
jan 1, 1999
10.547
-1.052
-9.07%
jan 1, 2000
10.867
+0.32
3.03%
jan 1, 2001
11.1
+0.233
2.15%
jan 1, 2002
10.838
-0.262
-2.36%
jan 1, 2003
11.03
+0.192
1.77%
jan 1, 2004
11.298
+0.268
2.43%
jan 1, 2005
10.862
-0.436
-3.86%
jan 1, 2006
10.558
-0.305
-2.81%
jan 1, 2007
9.754
-0.804
-7.61%
jan 1, 2008
10.131
+0.377
3.86%
jan 1, 2009
10.531
+0.4
3.95%
jan 1, 2010
11.187
+0.656
6.23%
jan 1, 2011
10.538
-0.649
-5.8%
jan 1, 2012
10.682
+0.144
1.36%
jan 1, 2013
10.334
-0.347
-3.25%
jan 1, 2014
10.798
+0.464
4.49%
Ranking of countries by current statistics by years


Comments: