29
/
en
AIzaSyAYiBZKx7MnpbEhh9jyipgxe19OcubqV5w
April 1, 2024
52470
OECD members
OED
false
2
1
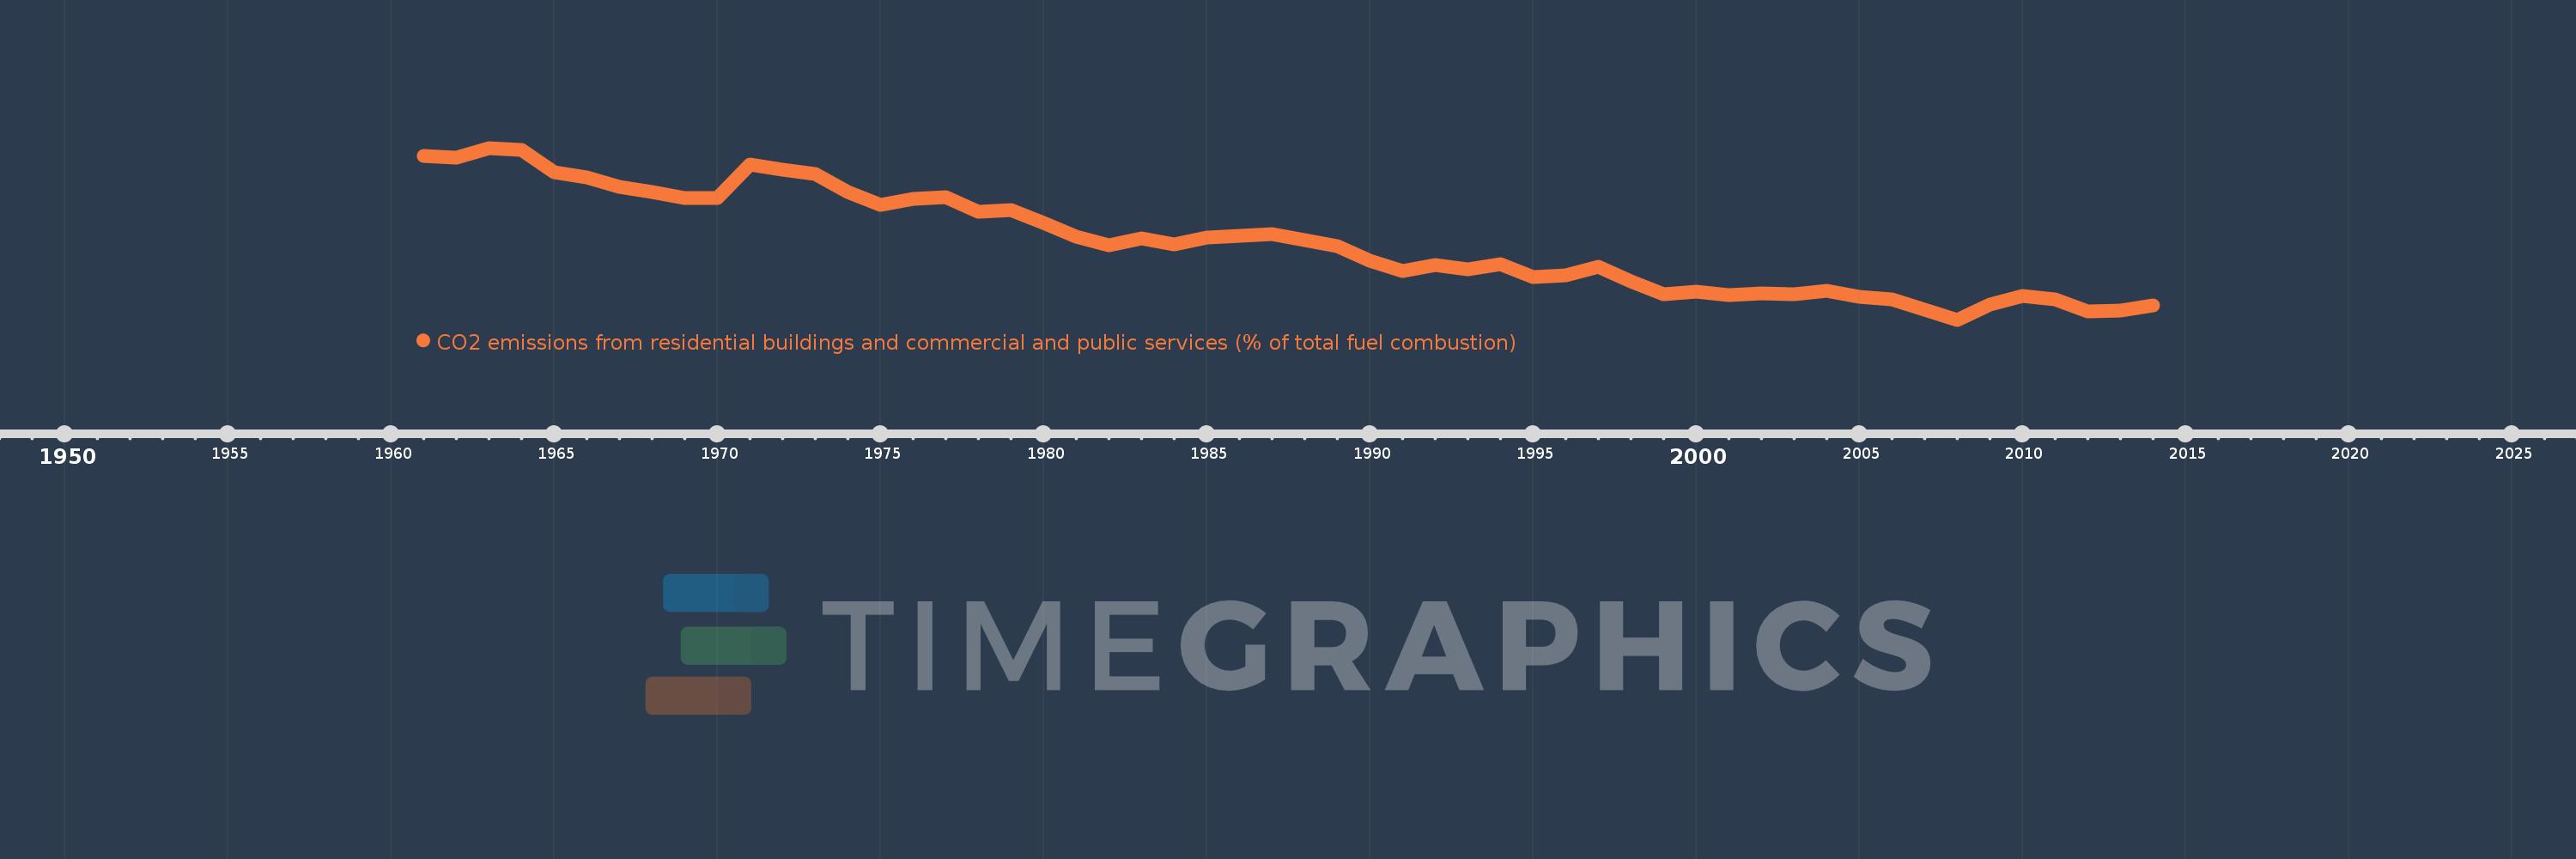
CO2 emissions from residential buildings and commercial and public services (% of total fuel combustion)
2014,2013,2012,2011,2010,2009,2008,2007,2006,2005,2004,2003,2002,2001,2000,1999,1998,1997,1996,1995,1994,1993,1992,1991,1990,1989,1988,1987,1986,1985,1984,1983,1982,1981,1980,1979,1978,1977,1976,1975,1974,1973,1972,1971,1970,1969,1968,1967,1966,1965,1964,1963,1962,1961
This statistics in other country:
AlbaniaAlgeriaAngolaArab WorldArgentinaArmeniaAustraliaAustriaAzerbaijanBahrainBangladeshBelarusBelgiumBeninBoliviaBosnia and HerzegovinaBotswanaBrazilBrunei DarussalamBulgariaCambodiaCameroonCanadaCaribbean small statesCentral Europe and the BalticsChileChinaColombiaCongo, Dem. Rep.Congo, Rep.Costa RicaCote d'IvoireCroatiaCubaCuracaoCyprusCzech RepublicDenmarkDominican RepublicEarly-demographic dividendEast Asia & PacificEast Asia & Pacific (excluding high income)East Asia & Pacific (IDA & IBRD countries)EcuadorEgypt, Arab Rep.El SalvadorEritreaEstoniaEthiopiaEuro areaEurope & Central AsiaEurope & Central Asia (excluding high income)Europe & Central Asia (IDA & IBRD countries)European UnionFinlandFragile and conflict affected situationsFranceGabonGeorgiaGermanyGhanaGibraltarGreeceGuatemalaHaitiHeavily indebted poor countries (HIPC)High incomeHondurasHong Kong SAR, ChinaHungaryIBRD onlyIcelandIDA & IBRD totalIDA blendIDA onlyIDA totalIndiaIndonesiaIran, Islamic Rep.IraqIrelandIsraelItalyJamaicaJapanJordanKazakhstanKenyaKorea, Dem. People’s Rep.Korea, Rep.KosovoKuwaitKyrgyz RepublicLate-demographic dividendLatin America & Caribbean Latin America & Caribbean (excluding high income)Latin America & the Caribbean (IDA & IBRD countries)LatviaLeast developed countries: UN classificationLebanonLibyaLithuaniaLow & middle incomeLow incomeLower middle incomeLuxembourgMacedonia, FYRMalaysiaMaltaMauritiusMexicoMiddle East & North AfricaMiddle East & North Africa (excluding high income)Middle East & North Africa (IDA & IBRD countries)Middle incomeMoldovaMongoliaMontenegroMoroccoMozambiqueMyanmarNamibiaNepalNetherlandsNew ZealandNicaraguaNigerNigeriaNorth AmericaNorwayOECD membersOmanOther small statesPakistanPanamaParaguayPeruPhilippinesPolandPortugalPost-demographic dividendPre-demographic dividendQatarRomaniaRussian FederationSaudi ArabiaSenegalSerbiaSingaporeSlovak RepublicSloveniaSmall statesSouth AfricaSouth AsiaSouth Asia (IDA & IBRD)South SudanSpainSri LankaSub-Saharan Africa Sub-Saharan Africa (excluding high income)Sub-Saharan Africa (IDA & IBRD countries)SudanSwedenSwitzerlandSyrian Arab RepublicTajikistanTanzaniaThailandTogoTrinidad and TobagoTunisiaTurkeyTurkmenistanUkraineUnited Arab EmiratesUnited KingdomUnited StatesUpper middle incomeUruguayUzbekistanVenezuela, RBVietnamWorldYemen, Rep.ZambiaZimbabwe Timeline:
This timeline shows a graph from 1961 to 2014 of OECD members. No data until 1960. Number of actual observations by date: 54.
Source name:
World Development Indicators
Source organization:
IEA Statistics © OECD/IEA 2014 (http://www.iea.org/stats/index.asp), subject to https://www.iea.org/t&c/termsandconditions/
Categories, topics:
Environment
Last updated:
apr 23, 2017
Indicators value changes by year
Minimum:
11.689
jan 1, 2008
Maximum:
20.763
jan 1, 1963
At the date of observation
Value
Absolute change
Change from previous value
jan 1, 1961
20.346
+20.346
0.0%
jan 1, 1962
20.233
-0.113
-0.55%
jan 1, 1963
20.763
+0.53
2.62%
jan 1, 1964
20.676
-0.087
-0.42%
jan 1, 1965
19.482
-1.193
-5.77%
jan 1, 1966
19.226
-0.256
-1.32%
jan 1, 1967
18.72
-0.506
-2.63%
jan 1, 1968
18.438
-0.282
-1.51%
jan 1, 1969
18.096
-0.342
-1.86%
jan 1, 1970
18.098
+0.002
0.01%
jan 1, 1971
19.894
+1.796
9.93%
jan 1, 1972
19.598
-0.296
-1.49%
jan 1, 1973
19.387
-0.211
-1.08%
jan 1, 1974
18.416
-0.972
-5.01%
jan 1, 1975
17.75
-0.666
-3.62%
jan 1, 1976
18.068
+0.318
1.79%
jan 1, 1977
18.172
+0.104
0.58%
jan 1, 1978
17.401
-0.771
-4.24%
jan 1, 1979
17.494
+0.093
0.53%
jan 1, 1980
16.784
-0.71
-4.06%
jan 1, 1981
16.054
-0.73
-4.35%
jan 1, 1982
15.636
-0.418
-2.61%
jan 1, 1983
15.99
+0.354
2.26%
jan 1, 1984
15.649
-0.341
-2.13%
jan 1, 1985
16.009
+0.36
2.3%
jan 1, 1986
16.129
+0.12
0.75%
jan 1, 1987
16.209
+0.08
0.5%
jan 1, 1988
15.888
-0.321
-1.98%
jan 1, 1989
15.567
-0.321
-2.02%
jan 1, 1990
14.824
-0.743
-4.77%
jan 1, 1991
14.247
-0.578
-3.9%
jan 1, 1992
14.596
+0.349
2.45%
jan 1, 1993
14.357
-0.239
-1.63%
jan 1, 1994
14.624
+0.267
1.86%
jan 1, 1995
13.928
-0.696
-4.76%
jan 1, 1996
14.039
+0.111
0.8%
jan 1, 1997
14.483
+0.445
3.17%
jan 1, 1998
13.731
-0.752
-5.19%
jan 1, 1999
13.055
-0.676
-4.93%
jan 1, 2000
13.185
+0.13
1.0%
jan 1, 2001
12.972
-0.213
-1.62%
jan 1, 2002
13.104
+0.132
1.02%
jan 1, 2003
13.036
-0.068
-0.52%
jan 1, 2004
13.218
+0.181
1.39%
jan 1, 2005
12.923
-0.295
-2.23%
jan 1, 2006
12.757
-0.165
-1.28%
jan 1, 2007
12.234
-0.523
-4.1%
jan 1, 2008
11.689
-0.544
-4.45%
jan 1, 2009
12.491
+0.801
6.86%
jan 1, 2010
12.966
+0.475
3.8%
jan 1, 2011
12.752
-0.214
-1.65%
jan 1, 2012
12.146
-0.606
-4.75%
jan 1, 2013
12.197
+0.051
0.42%
jan 1, 2014
12.429
+0.232
1.9%
Ranking of countries by current statistics by years


Comments: