29
/
en
AIzaSyAYiBZKx7MnpbEhh9jyipgxe19OcubqV5w
April 1, 2024
158289
Iraq
IRQ
true
2
1
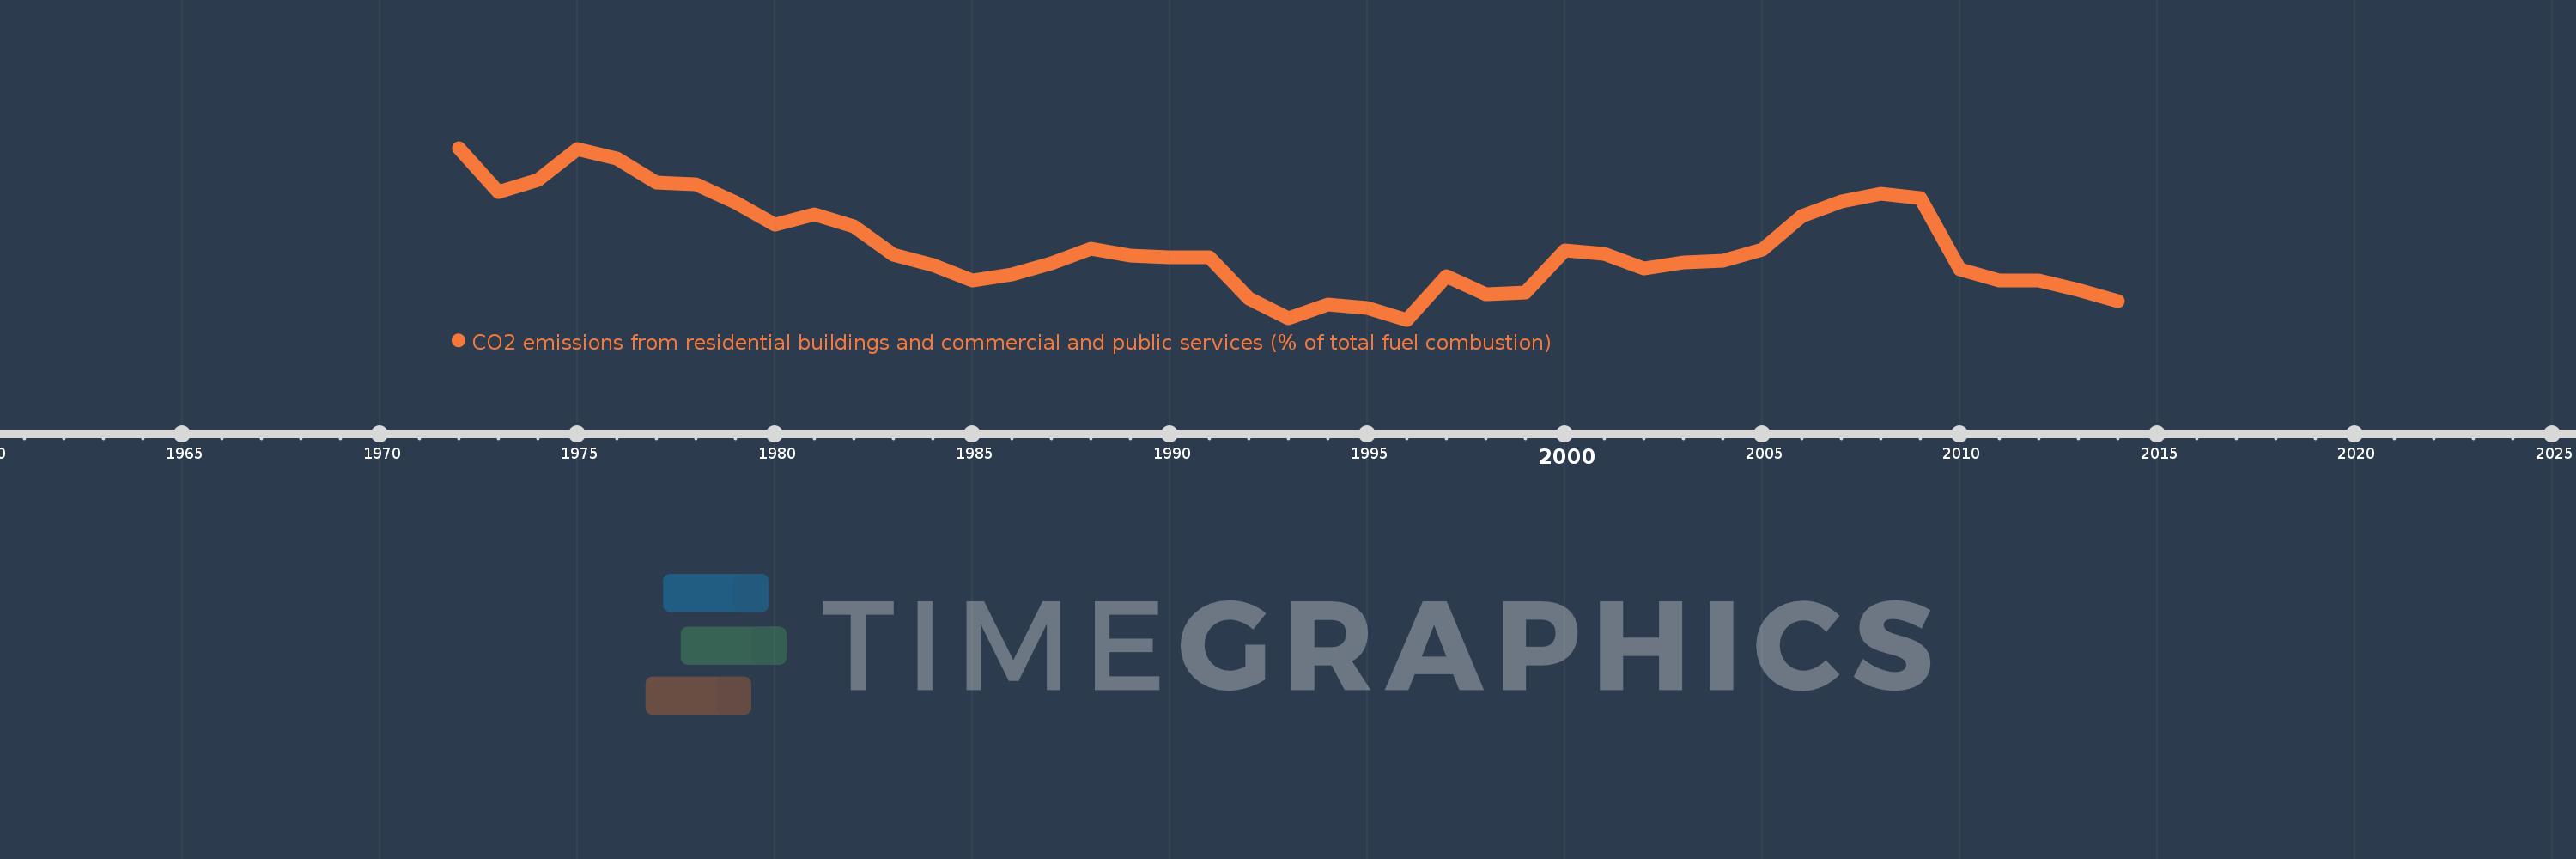
CO2 emissions from residential buildings and commercial and public services (% of total fuel combustion)
2014,2013,2012,2011,2010,2009,2008,2007,2006,2005,2004,2003,2002,2001,2000,1999,1998,1997,1996,1995,1994,1993,1992,1991,1990,1989,1988,1987,1986,1985,1984,1983,1982,1981,1980,1979,1978,1977,1976,1975,1974,1973,1972
This statistics in other country:
AlbaniaAlgeriaAngolaArab WorldArgentinaArmeniaAustraliaAustriaAzerbaijanBahrainBangladeshBelarusBelgiumBeninBoliviaBosnia and HerzegovinaBotswanaBrazilBrunei DarussalamBulgariaCambodiaCameroonCanadaCaribbean small statesCentral Europe and the BalticsChileChinaColombiaCongo, Dem. Rep.Congo, Rep.Costa RicaCote d'IvoireCroatiaCubaCuracaoCyprusCzech RepublicDenmarkDominican RepublicEarly-demographic dividendEast Asia & PacificEast Asia & Pacific (excluding high income)East Asia & Pacific (IDA & IBRD countries)EcuadorEgypt, Arab Rep.El SalvadorEritreaEstoniaEthiopiaEuro areaEurope & Central AsiaEurope & Central Asia (excluding high income)Europe & Central Asia (IDA & IBRD countries)European UnionFinlandFragile and conflict affected situationsFranceGabonGeorgiaGermanyGhanaGibraltarGreeceGuatemalaHaitiHeavily indebted poor countries (HIPC)High incomeHondurasHong Kong SAR, ChinaHungaryIBRD onlyIcelandIDA & IBRD totalIDA blendIDA onlyIDA totalIndiaIndonesiaIran, Islamic Rep.IraqIrelandIsraelItalyJamaicaJapanJordanKazakhstanKenyaKorea, Dem. People’s Rep.Korea, Rep.KosovoKuwaitKyrgyz RepublicLate-demographic dividendLatin America & Caribbean Latin America & Caribbean (excluding high income)Latin America & the Caribbean (IDA & IBRD countries)LatviaLeast developed countries: UN classificationLebanonLibyaLithuaniaLow & middle incomeLow incomeLower middle incomeLuxembourgMacedonia, FYRMalaysiaMaltaMauritiusMexicoMiddle East & North AfricaMiddle East & North Africa (excluding high income)Middle East & North Africa (IDA & IBRD countries)Middle incomeMoldovaMongoliaMontenegroMoroccoMozambiqueMyanmarNamibiaNepalNetherlandsNew ZealandNicaraguaNigerNigeriaNorth AmericaNorwayOECD membersOmanOther small statesPakistanPanamaParaguayPeruPhilippinesPolandPortugalPost-demographic dividendPre-demographic dividendQatarRomaniaRussian FederationSaudi ArabiaSenegalSerbiaSingaporeSlovak RepublicSloveniaSmall statesSouth AfricaSouth AsiaSouth Asia (IDA & IBRD)South SudanSpainSri LankaSub-Saharan Africa Sub-Saharan Africa (excluding high income)Sub-Saharan Africa (IDA & IBRD countries)SudanSwedenSwitzerlandSyrian Arab RepublicTajikistanTanzaniaThailandTogoTrinidad and TobagoTunisiaTurkeyTurkmenistanUkraineUnited Arab EmiratesUnited KingdomUnited StatesUpper middle incomeUruguayUzbekistanVenezuela, RBVietnamWorldYemen, Rep.ZambiaZimbabwe Timeline:
This timeline shows a graph from 1972 to 2014 of Iraq. No data until 1971. Number of actual observations by date: 43.
Source name:
World Development Indicators
Source organization:
IEA Statistics © OECD/IEA 2014 (http://www.iea.org/stats/index.asp), subject to https://www.iea.org/t&c/termsandconditions/
Categories, topics:
Environment
Last updated:
apr 23, 2017
Indicators value changes by year
Maximum:
21.048
jan 1, 1972
At the date of observation
Value
Absolute change
Change from previous value
jan 1, 1972
21.048
+21.048
0.0%
jan 1, 1973
17.406
-3.641
-17.3%
jan 1, 1974
18.39
+0.983
5.65%
jan 1, 1975
20.983
+2.593
14.1%
jan 1, 1976
20.155
-0.828
-3.95%
jan 1, 1977
18.205
-1.949
-9.67%
jan 1, 1978
18.047
-0.159
-0.87%
jan 1, 1979
16.601
-1.446
-8.01%
jan 1, 1980
14.706
-1.895
-11.41%
jan 1, 1981
15.601
+0.895
6.09%
jan 1, 1982
14.57
-1.031
-6.61%
jan 1, 1983
12.297
-2.273
-15.6%
jan 1, 1984
11.384
-0.914
-7.43%
jan 1, 1985
10.13
-1.254
-11.02%
jan 1, 1986
10.609
+0.479
4.73%
jan 1, 1987
11.588
+0.98
9.23%
jan 1, 1988
12.762
+1.174
10.13%
jan 1, 1989
12.201
-0.561
-4.4%
jan 1, 1990
12.055
-0.146
-1.19%
jan 1, 1991
12.028
-0.027
-0.23%
jan 1, 1992
8.68
-3.348
-27.83%
jan 1, 1993
7.047
-1.633
-18.81%
jan 1, 1994
8.185
+1.138
16.15%
jan 1, 1995
7.853
-0.332
-4.05%
jan 1, 1996
6.914
-0.939
-11.96%
jan 1, 1997
10.476
+3.562
51.52%
jan 1, 1998
9.016
-1.46
-13.94%
jan 1, 1999
9.129
+0.112
1.25%
jan 1, 2000
12.592
+3.463
37.94%
jan 1, 2001
12.341
-0.251
-1.99%
jan 1, 2002
11.11
-1.231
-9.98%
jan 1, 2003
11.638
+0.528
4.75%
jan 1, 2004
11.802
+0.164
1.41%
jan 1, 2005
12.707
+0.905
7.67%
jan 1, 2006
15.418
+2.71
21.33%
jan 1, 2007
16.649
+1.232
7.99%
jan 1, 2008
17.272
+0.623
3.74%
jan 1, 2009
16.959
-0.313
-1.81%
jan 1, 2010
11.078
-5.881
-34.68%
jan 1, 2011
10.118
-0.961
-8.67%
jan 1, 2012
10.152
+0.035
0.34%
jan 1, 2013
9.377
-0.775
-7.63%
jan 1, 2014
8.465
-0.912
-9.73%
Ranking of countries by current statistics by years


Comments: