29
/
en
AIzaSyAYiBZKx7MnpbEhh9jyipgxe19OcubqV5w
April 1, 2024
109431
Congo, Dem. Rep.
COD
true
2
1
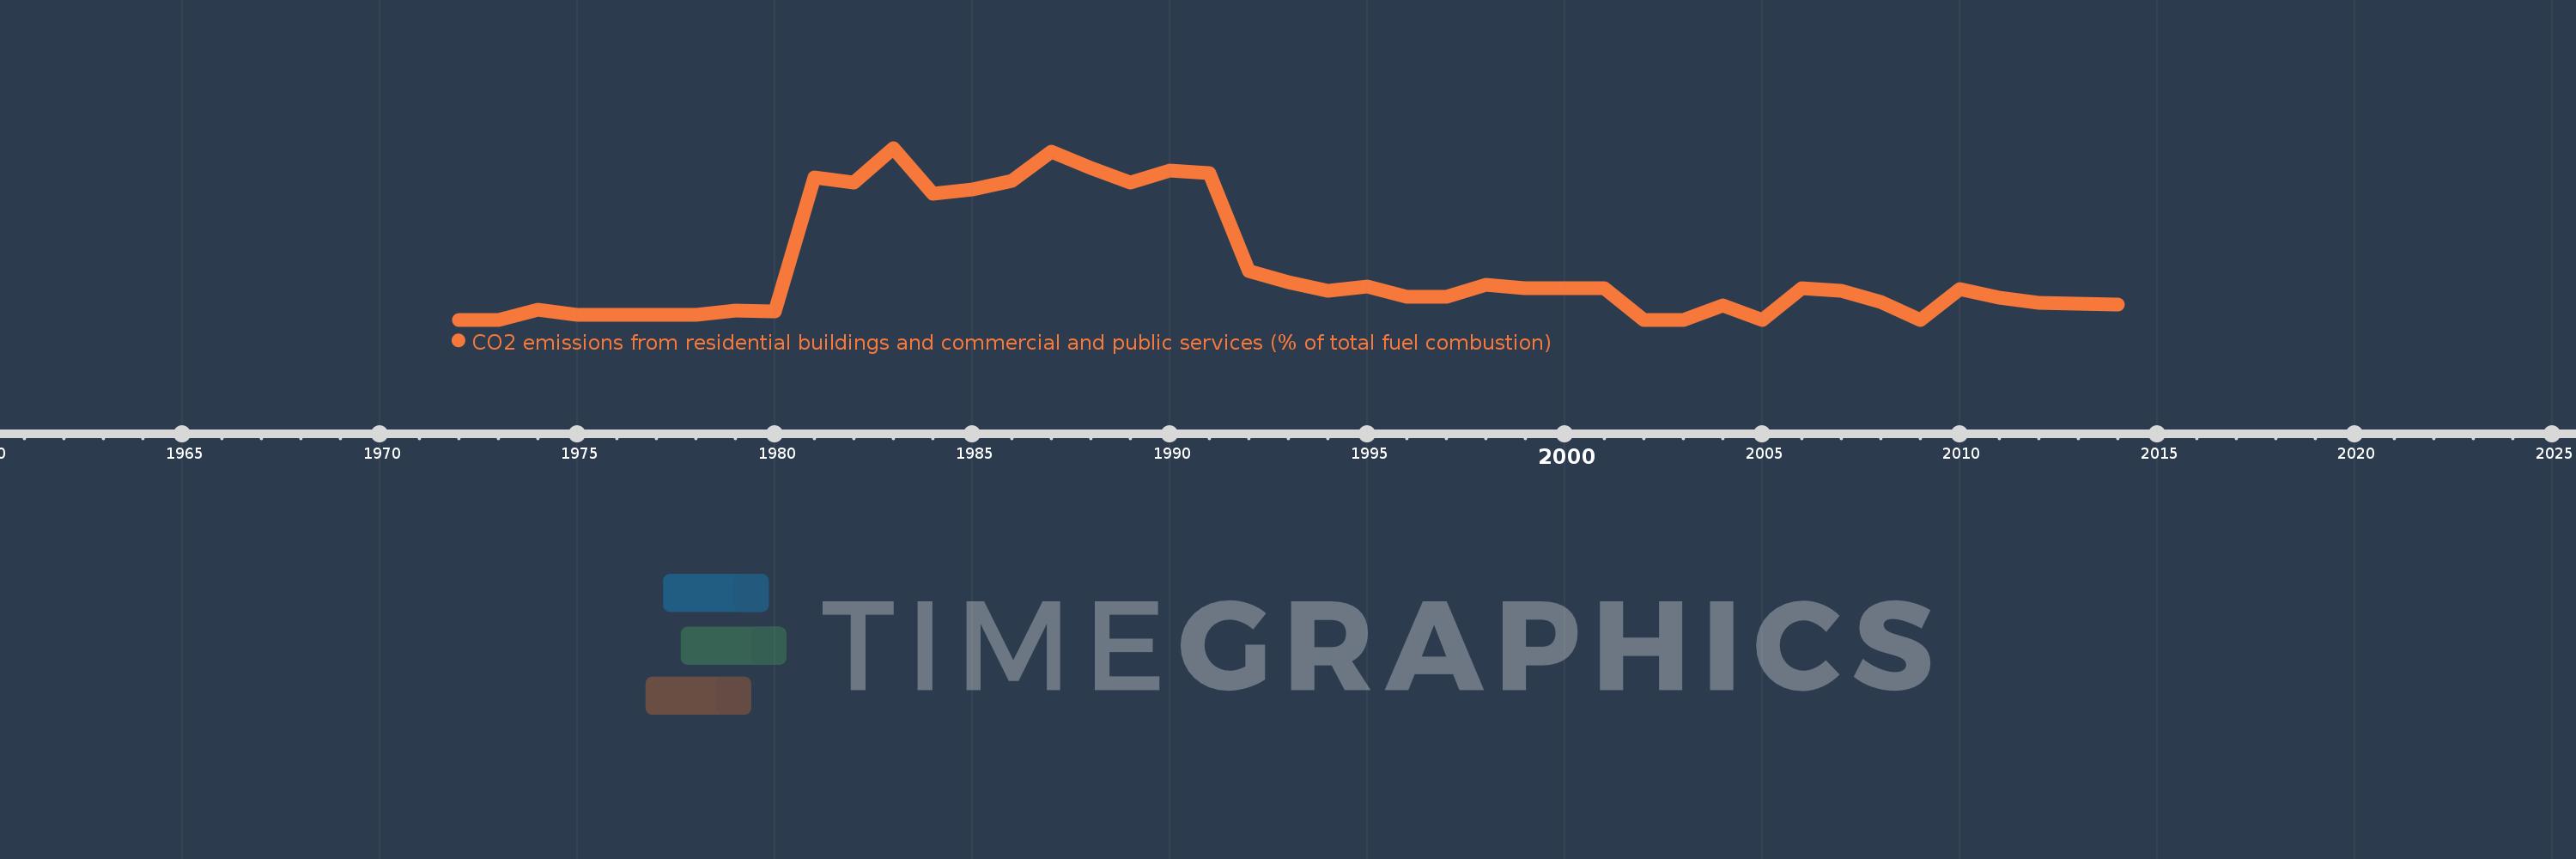
CO2 emissions from residential buildings and commercial and public services (% of total fuel combustion)
2014,2013,2012,2011,2010,2009,2008,2007,2006,2005,2004,2003,2002,2001,2000,1999,1998,1997,1996,1995,1994,1993,1992,1991,1990,1989,1988,1987,1986,1985,1984,1983,1982,1981,1980,1979,1978,1977,1976,1975,1974,1973,1972
This statistics in other country:
AlbaniaAlgeriaAngolaArab WorldArgentinaArmeniaAustraliaAustriaAzerbaijanBahrainBangladeshBelarusBelgiumBeninBoliviaBosnia and HerzegovinaBotswanaBrazilBrunei DarussalamBulgariaCambodiaCameroonCanadaCaribbean small statesCentral Europe and the BalticsChileChinaColombiaCongo, Dem. Rep.Congo, Rep.Costa RicaCote d'IvoireCroatiaCubaCuracaoCyprusCzech RepublicDenmarkDominican RepublicEarly-demographic dividendEast Asia & PacificEast Asia & Pacific (excluding high income)East Asia & Pacific (IDA & IBRD countries)EcuadorEgypt, Arab Rep.El SalvadorEritreaEstoniaEthiopiaEuro areaEurope & Central AsiaEurope & Central Asia (excluding high income)Europe & Central Asia (IDA & IBRD countries)European UnionFinlandFragile and conflict affected situationsFranceGabonGeorgiaGermanyGhanaGibraltarGreeceGuatemalaHaitiHeavily indebted poor countries (HIPC)High incomeHondurasHong Kong SAR, ChinaHungaryIBRD onlyIcelandIDA & IBRD totalIDA blendIDA onlyIDA totalIndiaIndonesiaIran, Islamic Rep.IraqIrelandIsraelItalyJamaicaJapanJordanKazakhstanKenyaKorea, Dem. People’s Rep.Korea, Rep.KosovoKuwaitKyrgyz RepublicLate-demographic dividendLatin America & Caribbean Latin America & Caribbean (excluding high income)Latin America & the Caribbean (IDA & IBRD countries)LatviaLeast developed countries: UN classificationLebanonLibyaLithuaniaLow & middle incomeLow incomeLower middle incomeLuxembourgMacedonia, FYRMalaysiaMaltaMauritiusMexicoMiddle East & North AfricaMiddle East & North Africa (excluding high income)Middle East & North Africa (IDA & IBRD countries)Middle incomeMoldovaMongoliaMontenegroMoroccoMozambiqueMyanmarNamibiaNepalNetherlandsNew ZealandNicaraguaNigerNigeriaNorth AmericaNorwayOECD membersOmanOther small statesPakistanPanamaParaguayPeruPhilippinesPolandPortugalPost-demographic dividendPre-demographic dividendQatarRomaniaRussian FederationSaudi ArabiaSenegalSerbiaSingaporeSlovak RepublicSloveniaSmall statesSouth AfricaSouth AsiaSouth Asia (IDA & IBRD)South SudanSpainSri LankaSub-Saharan Africa Sub-Saharan Africa (excluding high income)Sub-Saharan Africa (IDA & IBRD countries)SudanSwedenSwitzerlandSyrian Arab RepublicTajikistanTanzaniaThailandTogoTrinidad and TobagoTunisiaTurkeyTurkmenistanUkraineUnited Arab EmiratesUnited KingdomUnited StatesUpper middle incomeUruguayUzbekistanVenezuela, RBVietnamWorldYemen, Rep.ZambiaZimbabwe Timeline:
This timeline shows a graph from 1972 to 2014 of Congo, Dem. Rep.. No data until 1971. Number of actual observations by date: 43.
Source name:
World Development Indicators
Source organization:
IEA Statistics © OECD/IEA 2014 (http://www.iea.org/stats/index.asp), subject to https://www.iea.org/t&c/termsandconditions/
Categories, topics:
Environment
Last updated:
apr 23, 2017
Indicators value changes by year
Maximum:
12.928
jan 1, 1983
At the date of observation
Value
Absolute change
Change from previous value
jan 1, 1974
0.763
+0.763
%
jan 1, 1975
0.372
-0.392
-51.3%
jan 1, 1976
0.382
+0.01
2.67%
jan 1, 1977
0.372
-0.01
-2.6%
jan 1, 1978
0.357
-0.015
-3.93%
jan 1, 1979
0.699
+0.342
95.8%
jan 1, 1980
0.625
-0.074
-10.62%
jan 1, 1981
10.726
+10.101
1.62K%
jan 1, 1982
10.324
-0.401
-3.74%
jan 1, 1983
12.928
+2.603
25.21%
jan 1, 1984
9.497
-3.431
-26.54%
jan 1, 1985
9.798
+0.301
3.17%
jan 1, 1986
10.462
+0.663
6.77%
jan 1, 1987
12.667
+2.205
21.08%
jan 1, 1988
11.446
-1.221
-9.64%
jan 1, 1989
10.345
-1.101
-9.62%
jan 1, 1990
11.212
+0.867
8.38%
jan 1, 1991
11.037
-0.175
-1.56%
jan 1, 1992
3.681
-7.356
-66.65%
jan 1, 1993
2.837
-0.844
-22.93%
jan 1, 1994
2.19
-0.647
-22.81%
jan 1, 1995
2.479
+0.29
13.22%
jan 1, 1996
1.754
-0.725
-29.24%
jan 1, 1997
1.739
-0.015
-0.87%
jan 1, 1998
2.609
+0.87
50.0%
jan 1, 1999
2.362
-0.246
-9.45%
jan 1, 2000
2.4
+0.038
1.6%
jan 1, 2001
2.353
-0.047
-1.96%
jan 1, 2002
0.0
-2.353
-100.0%
jan 1, 2004
1.064
+1.064
%
jan 1, 2005
0.0
-1.064
-100.0%
jan 1, 2006
2.344
+2.344
%
jan 1, 2007
2.174
-0.17
-7.25%
jan 1, 2008
1.325
-0.849
-39.07%
jan 1, 2009
0.0
-1.325
-100.0%
jan 1, 2010
2.339
+2.339
%
jan 1, 2011
1.63
-0.709
-30.3%
jan 1, 2012
1.299
-0.332
-20.35%
jan 1, 2013
1.23
-0.069
-5.33%
jan 1, 2014
1.141
-0.089
-7.22%
Ranking of countries by current statistics by years


Comments: