29
/
en
AIzaSyAYiBZKx7MnpbEhh9jyipgxe19OcubqV5w
April 1, 2024
157052
Iran, Islamic Rep.
IRN
true
2
1
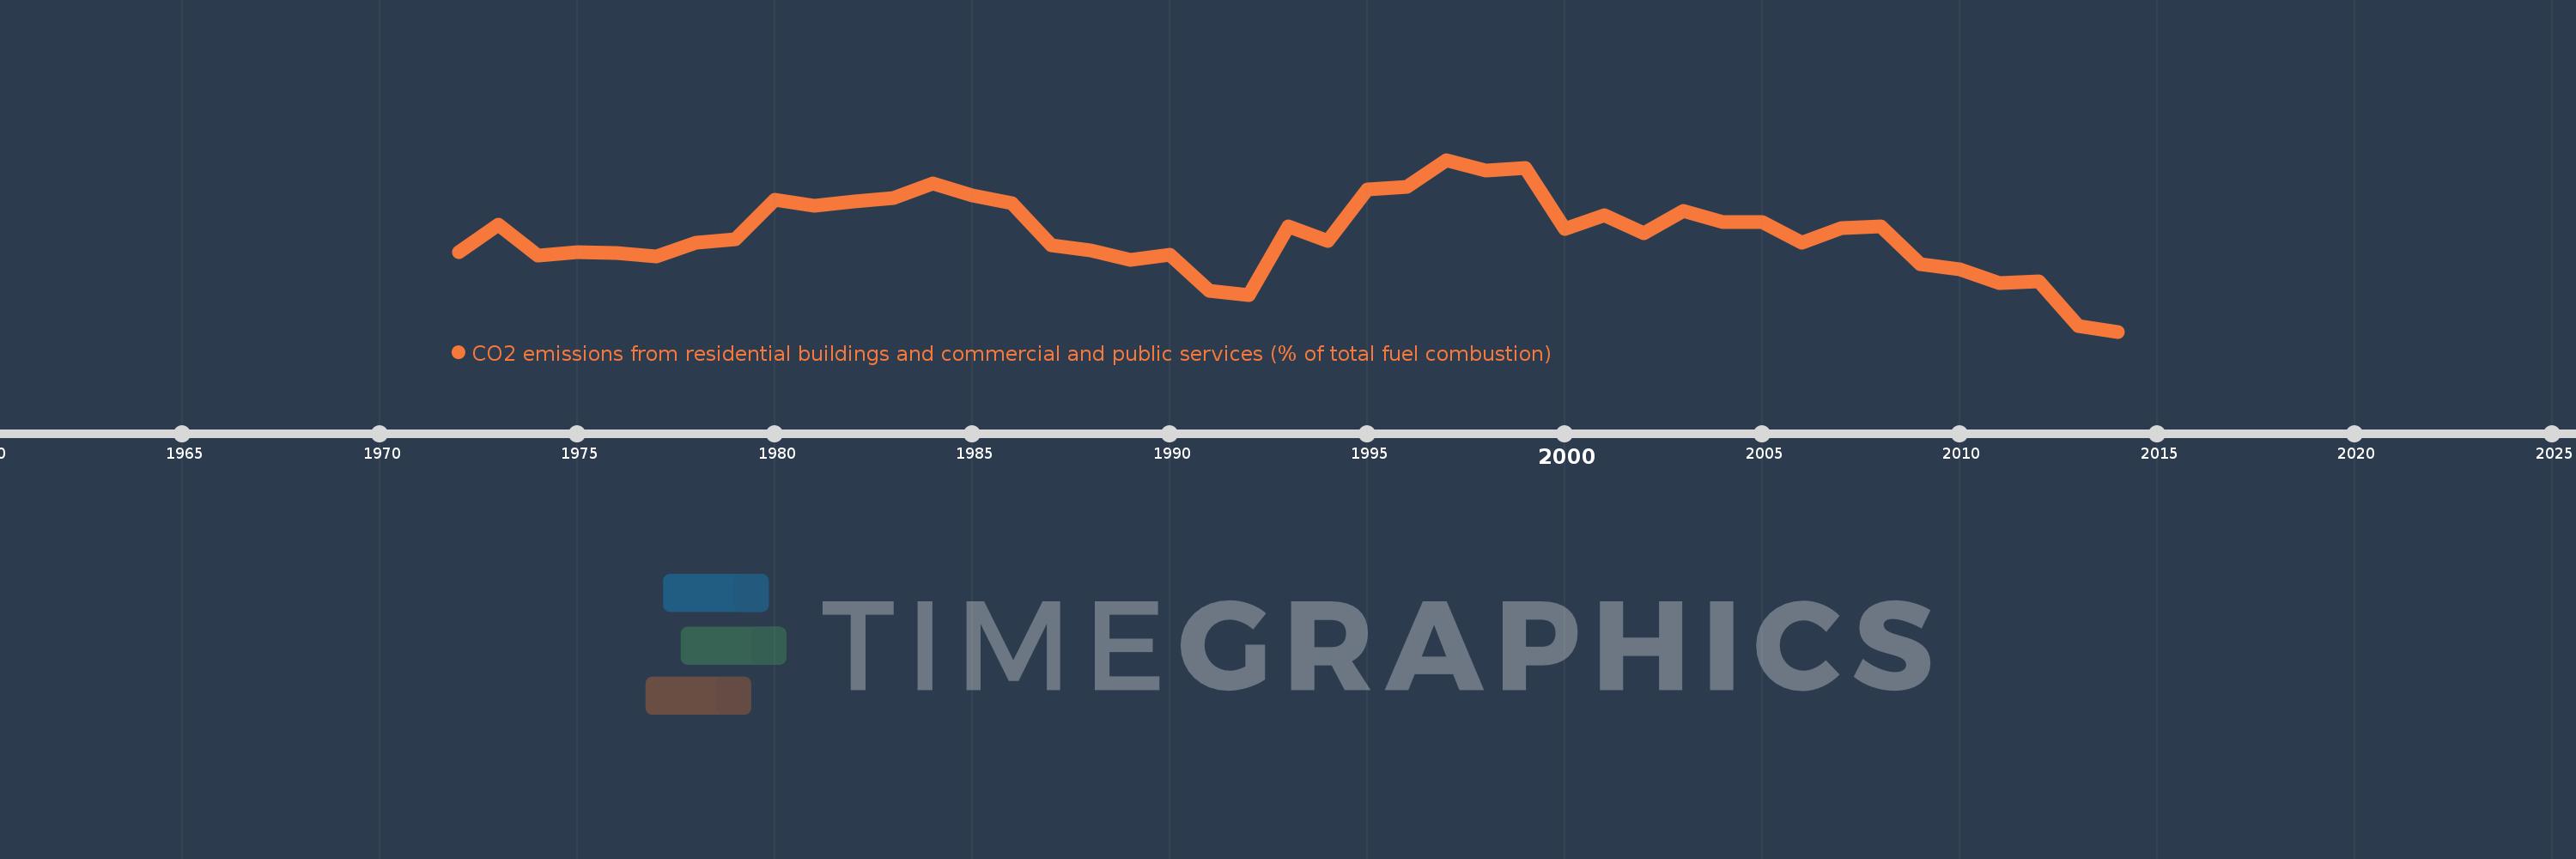
CO2 emissions from residential buildings and commercial and public services (% of total fuel combustion)
2014,2013,2012,2011,2010,2009,2008,2007,2006,2005,2004,2003,2002,2001,2000,1999,1998,1997,1996,1995,1994,1993,1992,1991,1990,1989,1988,1987,1986,1985,1984,1983,1982,1981,1980,1979,1978,1977,1976,1975,1974,1973,1972
This statistics in other country:
AlbaniaAlgeriaAngolaArab WorldArgentinaArmeniaAustraliaAustriaAzerbaijanBahrainBangladeshBelarusBelgiumBeninBoliviaBosnia and HerzegovinaBotswanaBrazilBrunei DarussalamBulgariaCambodiaCameroonCanadaCaribbean small statesCentral Europe and the BalticsChileChinaColombiaCongo, Dem. Rep.Congo, Rep.Costa RicaCote d'IvoireCroatiaCubaCuracaoCyprusCzech RepublicDenmarkDominican RepublicEarly-demographic dividendEast Asia & PacificEast Asia & Pacific (excluding high income)East Asia & Pacific (IDA & IBRD countries)EcuadorEgypt, Arab Rep.El SalvadorEritreaEstoniaEthiopiaEuro areaEurope & Central AsiaEurope & Central Asia (excluding high income)Europe & Central Asia (IDA & IBRD countries)European UnionFinlandFragile and conflict affected situationsFranceGabonGeorgiaGermanyGhanaGibraltarGreeceGuatemalaHaitiHeavily indebted poor countries (HIPC)High incomeHondurasHong Kong SAR, ChinaHungaryIBRD onlyIcelandIDA & IBRD totalIDA blendIDA onlyIDA totalIndiaIndonesiaIran, Islamic Rep.IraqIrelandIsraelItalyJamaicaJapanJordanKazakhstanKenyaKorea, Dem. People’s Rep.Korea, Rep.KosovoKuwaitKyrgyz RepublicLate-demographic dividendLatin America & Caribbean Latin America & Caribbean (excluding high income)Latin America & the Caribbean (IDA & IBRD countries)LatviaLeast developed countries: UN classificationLebanonLibyaLithuaniaLow & middle incomeLow incomeLower middle incomeLuxembourgMacedonia, FYRMalaysiaMaltaMauritiusMexicoMiddle East & North AfricaMiddle East & North Africa (excluding high income)Middle East & North Africa (IDA & IBRD countries)Middle incomeMoldovaMongoliaMontenegroMoroccoMozambiqueMyanmarNamibiaNepalNetherlandsNew ZealandNicaraguaNigerNigeriaNorth AmericaNorwayOECD membersOmanOther small statesPakistanPanamaParaguayPeruPhilippinesPolandPortugalPost-demographic dividendPre-demographic dividendQatarRomaniaRussian FederationSaudi ArabiaSenegalSerbiaSingaporeSlovak RepublicSloveniaSmall statesSouth AfricaSouth AsiaSouth Asia (IDA & IBRD)South SudanSpainSri LankaSub-Saharan Africa Sub-Saharan Africa (excluding high income)Sub-Saharan Africa (IDA & IBRD countries)SudanSwedenSwitzerlandSyrian Arab RepublicTajikistanTanzaniaThailandTogoTrinidad and TobagoTunisiaTurkeyTurkmenistanUkraineUnited Arab EmiratesUnited KingdomUnited StatesUpper middle incomeUruguayUzbekistanVenezuela, RBVietnamWorldYemen, Rep.ZambiaZimbabwe Timeline:
This timeline shows a graph from 1972 to 2014 of Iran, Islamic Rep.. No data until 1971. Number of actual observations by date: 43.
Source name:
World Development Indicators
Source organization:
IEA Statistics © OECD/IEA 2014 (http://www.iea.org/stats/index.asp), subject to https://www.iea.org/t&c/termsandconditions/
Categories, topics:
Environment
Last updated:
apr 23, 2017
Indicators value changes by year
Minimum:
21.667
jan 1, 2014
Maximum:
30.481
jan 1, 1997
At the date of observation
Value
Absolute change
Change from previous value
jan 1, 1972
25.739
+25.739
0.0%
jan 1, 1973
27.163
+1.424
5.53%
jan 1, 1974
25.572
-1.59
-5.85%
jan 1, 1975
25.733
+0.16
0.63%
jan 1, 1976
25.687
-0.045
-0.18%
jan 1, 1977
25.54
-0.148
-0.57%
jan 1, 1978
26.212
+0.672
2.63%
jan 1, 1979
26.41
+0.198
0.75%
jan 1, 1980
28.448
+2.037
7.71%
jan 1, 1981
28.123
-0.325
-1.14%
jan 1, 1982
28.349
+0.226
0.8%
jan 1, 1983
28.503
+0.154
0.54%
jan 1, 1984
29.248
+0.745
2.61%
jan 1, 1985
28.674
-0.573
-1.96%
jan 1, 1986
28.25
-0.424
-1.48%
jan 1, 1987
26.102
-2.148
-7.6%
jan 1, 1988
25.843
-0.259
-0.99%
jan 1, 1989
25.336
-0.507
-1.96%
jan 1, 1990
25.632
+0.296
1.17%
jan 1, 1991
23.747
-1.885
-7.35%
jan 1, 1992
23.562
-0.185
-0.78%
jan 1, 1993
27.061
+3.499
14.85%
jan 1, 1994
26.306
-0.755
-2.79%
jan 1, 1995
28.943
+2.637
10.02%
jan 1, 1996
29.107
+0.164
0.56%
jan 1, 1997
30.481
+1.375
4.72%
jan 1, 1998
29.934
-0.547
-1.79%
jan 1, 1999
30.05
+0.116
0.39%
jan 1, 2000
26.916
-3.134
-10.43%
jan 1, 2001
27.636
+0.721
2.68%
jan 1, 2002
26.693
-0.944
-3.41%
jan 1, 2003
27.871
+1.178
4.41%
jan 1, 2004
27.29
-0.581
-2.09%
jan 1, 2005
27.264
-0.026
-0.09%
jan 1, 2006
26.225
-1.038
-3.81%
jan 1, 2007
26.977
+0.752
2.87%
jan 1, 2008
27.082
+0.105
0.39%
jan 1, 2009
25.12
-1.963
-7.25%
jan 1, 2010
24.865
-0.254
-1.01%
jan 1, 2011
24.163
-0.702
-2.82%
jan 1, 2012
24.234
+0.071
0.3%
jan 1, 2013
21.971
-2.263
-9.34%
jan 1, 2014
21.667
-0.304
-1.39%
Ranking of countries by current statistics by years


Comments: