29
/
en
AIzaSyAYiBZKx7MnpbEhh9jyipgxe19OcubqV5w
April 1, 2024
124576
Egypt, Arab Rep.
EGY
true
2
1
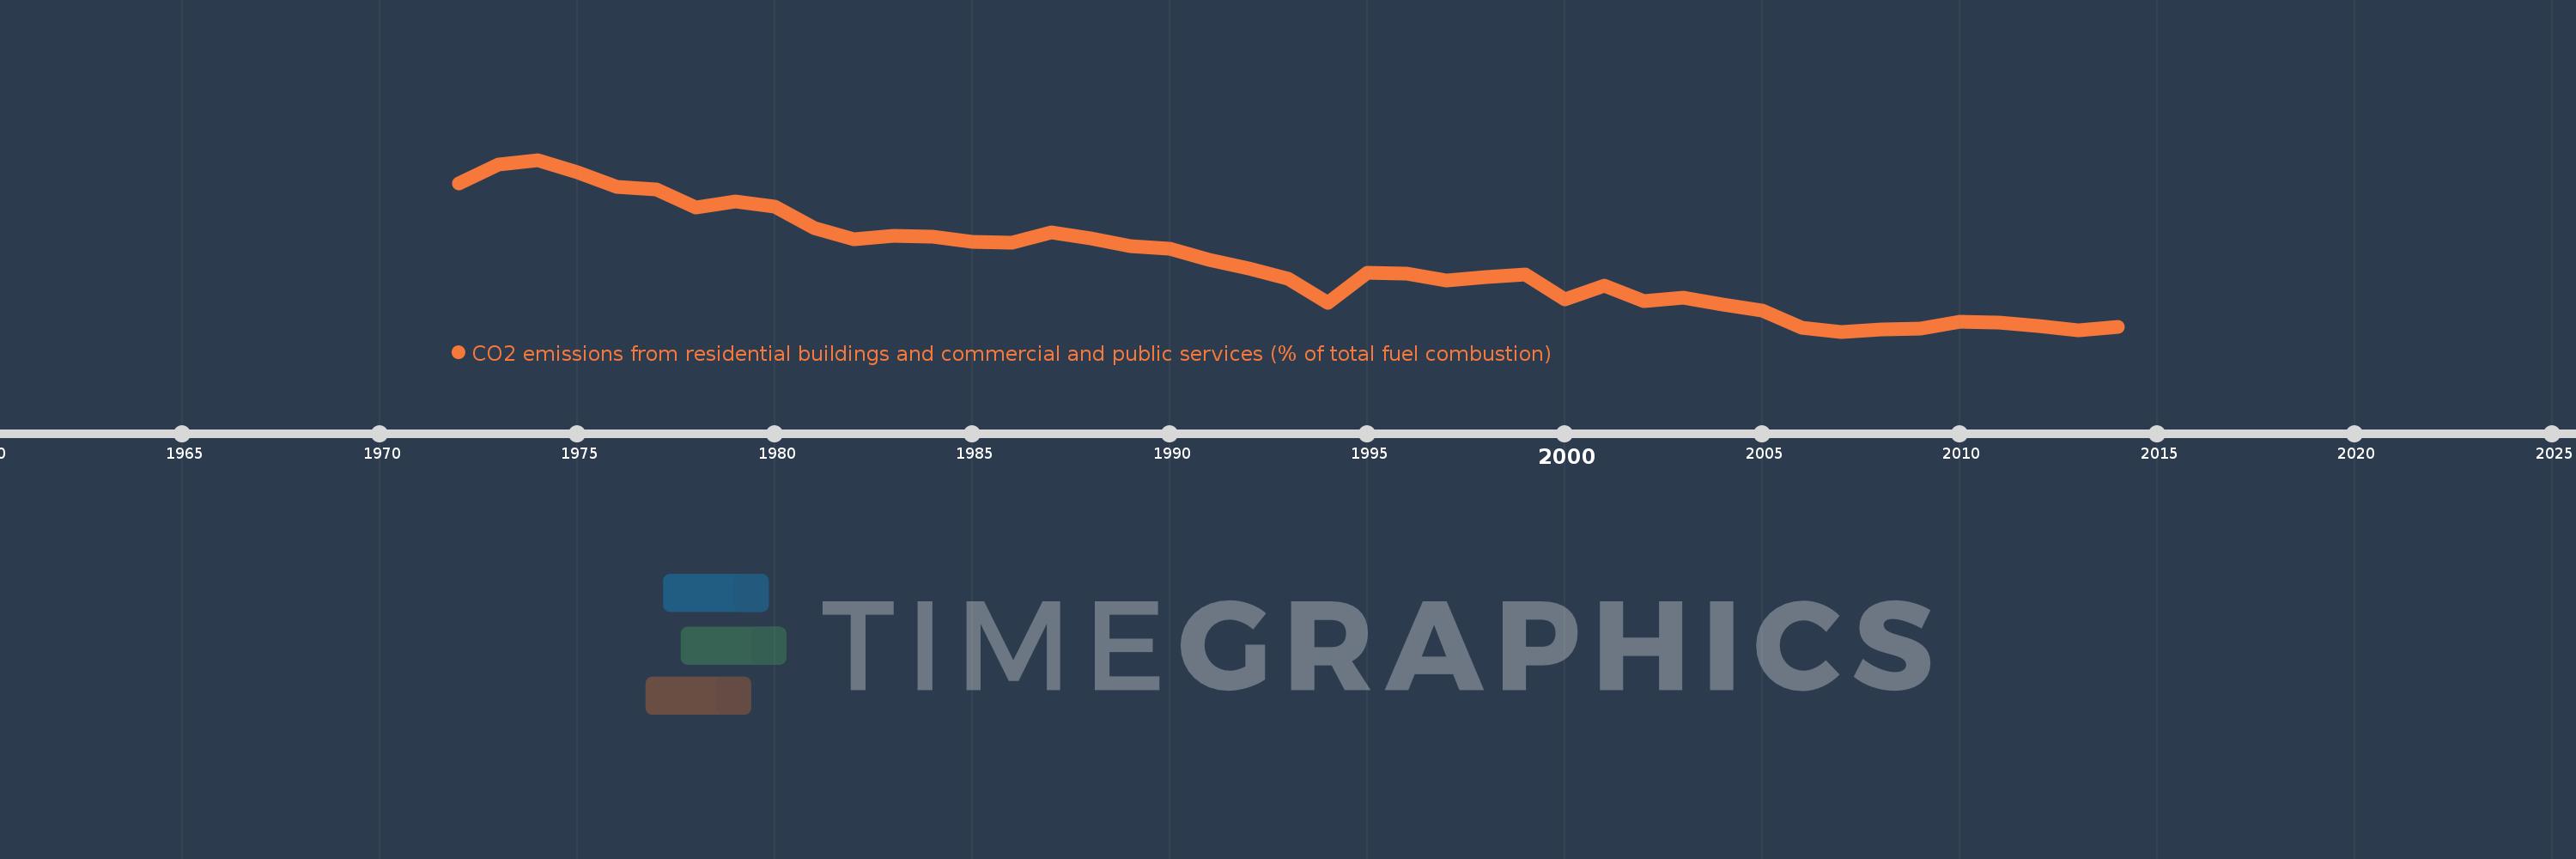
CO2 emissions from residential buildings and commercial and public services (% of total fuel combustion)
2014,2013,2012,2011,2010,2009,2008,2007,2006,2005,2004,2003,2002,2001,2000,1999,1998,1997,1996,1995,1994,1993,1992,1991,1990,1989,1988,1987,1986,1985,1984,1983,1982,1981,1980,1979,1978,1977,1976,1975,1974,1973,1972
This statistics in other country:
AlbaniaAlgeriaAngolaArab WorldArgentinaArmeniaAustraliaAustriaAzerbaijanBahrainBangladeshBelarusBelgiumBeninBoliviaBosnia and HerzegovinaBotswanaBrazilBrunei DarussalamBulgariaCambodiaCameroonCanadaCaribbean small statesCentral Europe and the BalticsChileChinaColombiaCongo, Dem. Rep.Congo, Rep.Costa RicaCote d'IvoireCroatiaCubaCuracaoCyprusCzech RepublicDenmarkDominican RepublicEarly-demographic dividendEast Asia & PacificEast Asia & Pacific (excluding high income)East Asia & Pacific (IDA & IBRD countries)EcuadorEgypt, Arab Rep.El SalvadorEritreaEstoniaEthiopiaEuro areaEurope & Central AsiaEurope & Central Asia (excluding high income)Europe & Central Asia (IDA & IBRD countries)European UnionFinlandFragile and conflict affected situationsFranceGabonGeorgiaGermanyGhanaGibraltarGreeceGuatemalaHaitiHeavily indebted poor countries (HIPC)High incomeHondurasHong Kong SAR, ChinaHungaryIBRD onlyIcelandIDA & IBRD totalIDA blendIDA onlyIDA totalIndiaIndonesiaIran, Islamic Rep.IraqIrelandIsraelItalyJamaicaJapanJordanKazakhstanKenyaKorea, Dem. People’s Rep.Korea, Rep.KosovoKuwaitKyrgyz RepublicLate-demographic dividendLatin America & Caribbean Latin America & Caribbean (excluding high income)Latin America & the Caribbean (IDA & IBRD countries)LatviaLeast developed countries: UN classificationLebanonLibyaLithuaniaLow & middle incomeLow incomeLower middle incomeLuxembourgMacedonia, FYRMalaysiaMaltaMauritiusMexicoMiddle East & North AfricaMiddle East & North Africa (excluding high income)Middle East & North Africa (IDA & IBRD countries)Middle incomeMoldovaMongoliaMontenegroMoroccoMozambiqueMyanmarNamibiaNepalNetherlandsNew ZealandNicaraguaNigerNigeriaNorth AmericaNorwayOECD membersOmanOther small statesPakistanPanamaParaguayPeruPhilippinesPolandPortugalPost-demographic dividendPre-demographic dividendQatarRomaniaRussian FederationSaudi ArabiaSenegalSerbiaSingaporeSlovak RepublicSloveniaSmall statesSouth AfricaSouth AsiaSouth Asia (IDA & IBRD)South SudanSpainSri LankaSub-Saharan Africa Sub-Saharan Africa (excluding high income)Sub-Saharan Africa (IDA & IBRD countries)SudanSwedenSwitzerlandSyrian Arab RepublicTajikistanTanzaniaThailandTogoTrinidad and TobagoTunisiaTurkeyTurkmenistanUkraineUnited Arab EmiratesUnited KingdomUnited StatesUpper middle incomeUruguayUzbekistanVenezuela, RBVietnamWorldYemen, Rep.ZambiaZimbabwe Timeline:
This timeline shows a graph from 1972 to 2014 of Egypt, Arab Rep.. No data until 1971. Number of actual observations by date: 43.
Source name:
World Development Indicators
Source organization:
IEA Statistics © OECD/IEA 2014 (http://www.iea.org/stats/index.asp), subject to https://www.iea.org/t&c/termsandconditions/
Categories, topics:
Environment
Last updated:
apr 23, 2017
Indicators value changes by year
Maximum:
18.608
jan 1, 1974
At the date of observation
Value
Absolute change
Change from previous value
jan 1, 1972
17.166
+17.166
0.0%
jan 1, 1973
18.331
+1.165
6.79%
jan 1, 1974
18.608
+0.277
1.51%
jan 1, 1975
17.848
-0.76
-4.08%
jan 1, 1976
16.973
-0.875
-4.9%
jan 1, 1977
16.79
-0.183
-1.08%
jan 1, 1978
15.724
-1.066
-6.35%
jan 1, 1979
16.09
+0.366
2.33%
jan 1, 1980
15.768
-0.322
-2.0%
jan 1, 1981
14.437
-1.331
-8.44%
jan 1, 1982
13.752
-0.684
-4.74%
jan 1, 1983
13.985
+0.232
1.69%
jan 1, 1984
13.91
-0.075
-0.53%
jan 1, 1985
13.601
-0.309
-2.22%
jan 1, 1986
13.545
-0.056
-0.41%
jan 1, 1987
14.192
+0.647
4.77%
jan 1, 1988
13.816
-0.377
-2.65%
jan 1, 1989
13.369
-0.446
-3.23%
jan 1, 1990
13.173
-0.196
-1.47%
jan 1, 1991
12.527
-0.646
-4.9%
jan 1, 1992
12.003
-0.524
-4.18%
jan 1, 1993
11.353
-0.651
-5.42%
jan 1, 1994
9.884
-1.469
-12.94%
jan 1, 1995
11.723
+1.839
18.6%
jan 1, 1996
11.647
-0.075
-0.64%
jan 1, 1997
11.223
-0.424
-3.64%
jan 1, 1998
11.459
+0.235
2.1%
jan 1, 1999
11.624
+0.165
1.44%
jan 1, 2000
10.106
-1.518
-13.06%
jan 1, 2001
10.912
+0.806
7.98%
jan 1, 2002
10.003
-0.909
-8.33%
jan 1, 2003
10.211
+0.209
2.09%
jan 1, 2004
9.777
-0.434
-4.25%
jan 1, 2005
9.436
-0.34
-3.48%
jan 1, 2006
8.346
-1.09
-11.56%
jan 1, 2007
8.131
-0.215
-2.57%
jan 1, 2008
8.278
+0.147
1.81%
jan 1, 2009
8.323
+0.045
0.54%
jan 1, 2010
8.754
+0.431
5.18%
jan 1, 2011
8.673
-0.081
-0.92%
jan 1, 2012
8.487
-0.187
-2.15%
jan 1, 2013
8.188
-0.298
-3.51%
jan 1, 2014
8.436
+0.248
3.03%
Ranking of countries by current statistics by years


Comments: