29
/
en
AIzaSyAYiBZKx7MnpbEhh9jyipgxe19OcubqV5w
April 1, 2024
99665
Cameroon
CMR
true
2
1
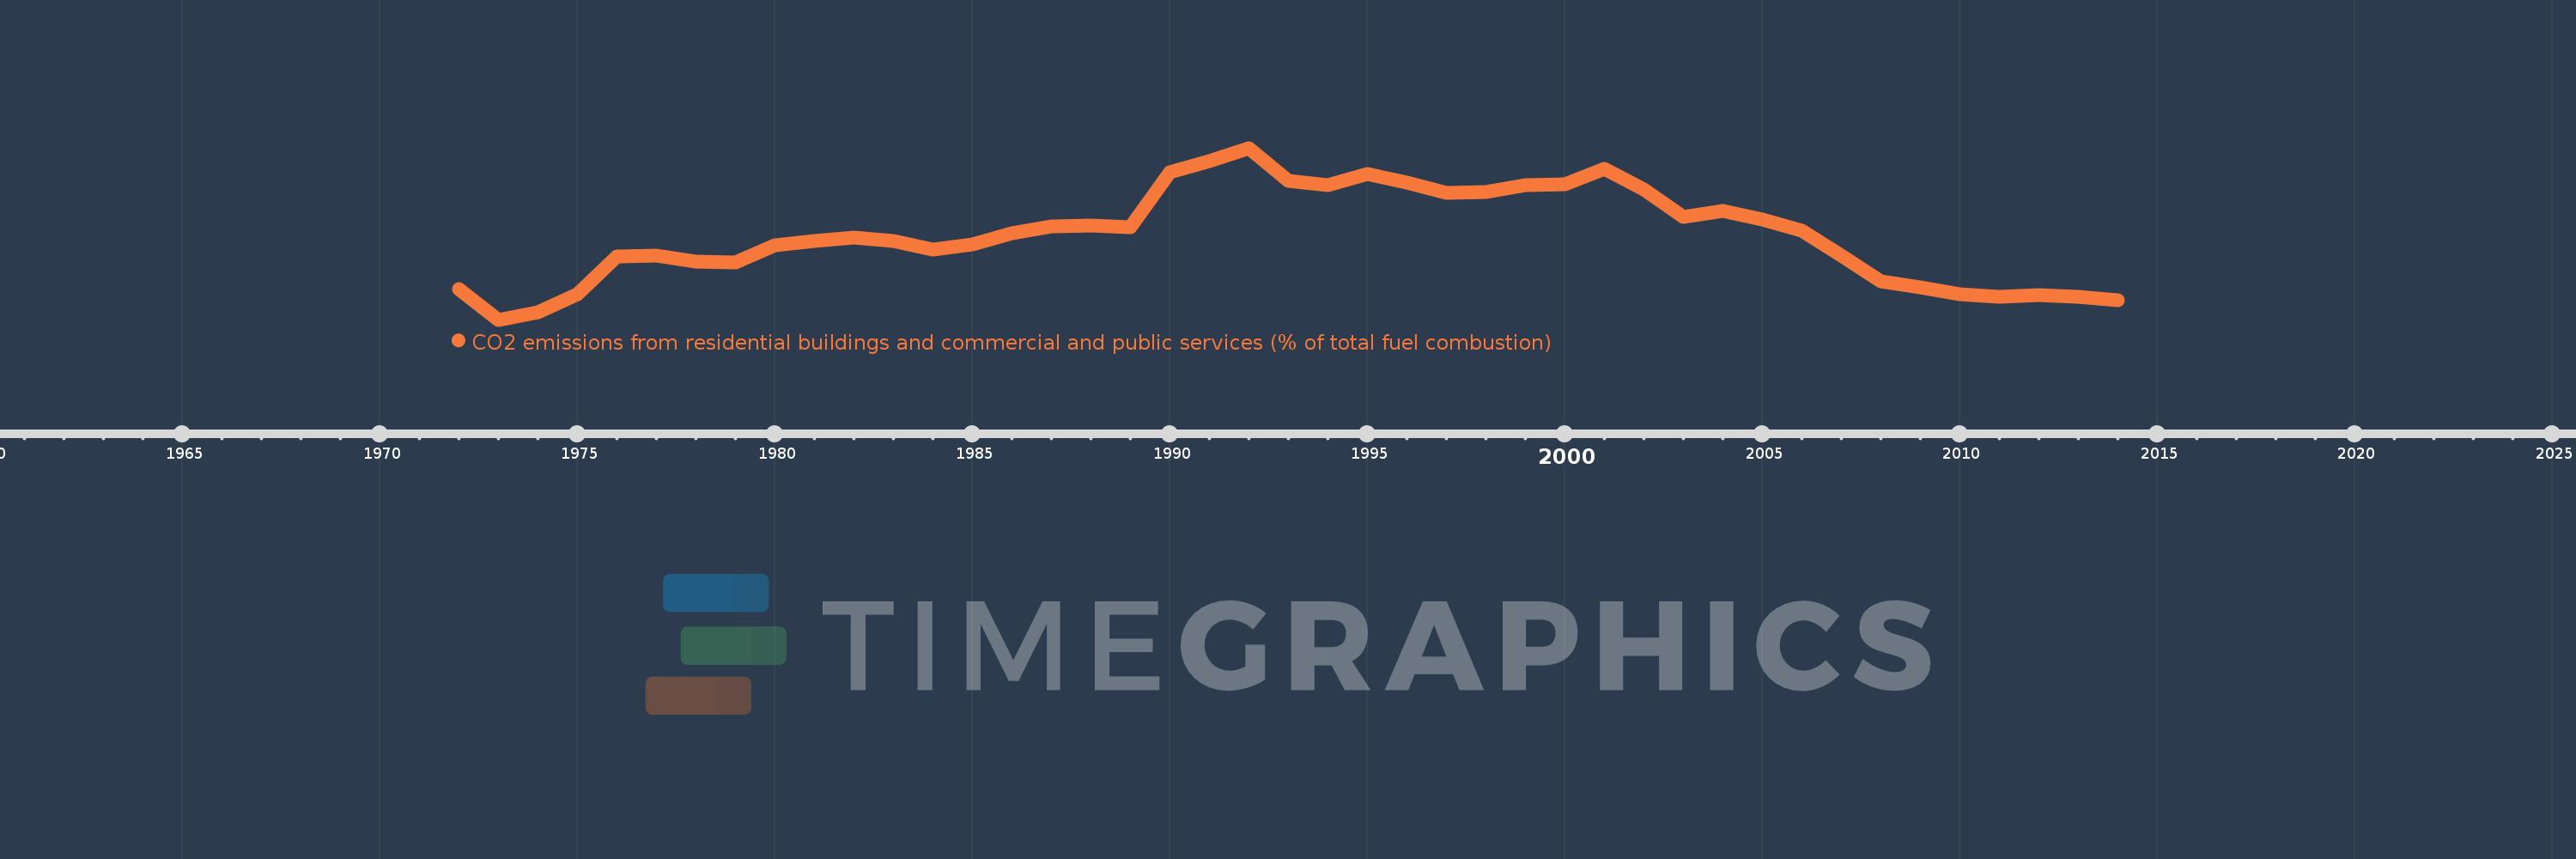
CO2 emissions from residential buildings and commercial and public services (% of total fuel combustion)
2014,2013,2012,2011,2010,2009,2008,2007,2006,2005,2004,2003,2002,2001,2000,1999,1998,1997,1996,1995,1994,1993,1992,1991,1990,1989,1988,1987,1986,1985,1984,1983,1982,1981,1980,1979,1978,1977,1976,1975,1974,1973,1972
This statistics in other country:
AlbaniaAlgeriaAngolaArab WorldArgentinaArmeniaAustraliaAustriaAzerbaijanBahrainBangladeshBelarusBelgiumBeninBoliviaBosnia and HerzegovinaBotswanaBrazilBrunei DarussalamBulgariaCambodiaCameroonCanadaCaribbean small statesCentral Europe and the BalticsChileChinaColombiaCongo, Dem. Rep.Congo, Rep.Costa RicaCote d'IvoireCroatiaCubaCuracaoCyprusCzech RepublicDenmarkDominican RepublicEarly-demographic dividendEast Asia & PacificEast Asia & Pacific (excluding high income)East Asia & Pacific (IDA & IBRD countries)EcuadorEgypt, Arab Rep.El SalvadorEritreaEstoniaEthiopiaEuro areaEurope & Central AsiaEurope & Central Asia (excluding high income)Europe & Central Asia (IDA & IBRD countries)European UnionFinlandFragile and conflict affected situationsFranceGabonGeorgiaGermanyGhanaGibraltarGreeceGuatemalaHaitiHeavily indebted poor countries (HIPC)High incomeHondurasHong Kong SAR, ChinaHungaryIBRD onlyIcelandIDA & IBRD totalIDA blendIDA onlyIDA totalIndiaIndonesiaIran, Islamic Rep.IraqIrelandIsraelItalyJamaicaJapanJordanKazakhstanKenyaKorea, Dem. People’s Rep.Korea, Rep.KosovoKuwaitKyrgyz RepublicLate-demographic dividendLatin America & Caribbean Latin America & Caribbean (excluding high income)Latin America & the Caribbean (IDA & IBRD countries)LatviaLeast developed countries: UN classificationLebanonLibyaLithuaniaLow & middle incomeLow incomeLower middle incomeLuxembourgMacedonia, FYRMalaysiaMaltaMauritiusMexicoMiddle East & North AfricaMiddle East & North Africa (excluding high income)Middle East & North Africa (IDA & IBRD countries)Middle incomeMoldovaMongoliaMontenegroMoroccoMozambiqueMyanmarNamibiaNepalNetherlandsNew ZealandNicaraguaNigerNigeriaNorth AmericaNorwayOECD membersOmanOther small statesPakistanPanamaParaguayPeruPhilippinesPolandPortugalPost-demographic dividendPre-demographic dividendQatarRomaniaRussian FederationSaudi ArabiaSenegalSerbiaSingaporeSlovak RepublicSloveniaSmall statesSouth AfricaSouth AsiaSouth Asia (IDA & IBRD)South SudanSpainSri LankaSub-Saharan Africa Sub-Saharan Africa (excluding high income)Sub-Saharan Africa (IDA & IBRD countries)SudanSwedenSwitzerlandSyrian Arab RepublicTajikistanTanzaniaThailandTogoTrinidad and TobagoTunisiaTurkeyTurkmenistanUkraineUnited Arab EmiratesUnited KingdomUnited StatesUpper middle incomeUruguayUzbekistanVenezuela, RBVietnamWorldYemen, Rep.ZambiaZimbabwe Timeline:
This timeline shows a graph from 1972 to 2014 of Cameroon. No data until 1971. Number of actual observations by date: 43.
Source name:
World Development Indicators
Source organization:
IEA Statistics © OECD/IEA 2014 (http://www.iea.org/stats/index.asp), subject to https://www.iea.org/t&c/termsandconditions/
Categories, topics:
Environment
Last updated:
apr 23, 2017
Indicators value changes by year
Maximum:
27.984
jan 1, 1992
At the date of observation
Value
Absolute change
Change from previous value
jan 1, 1972
8.219
+8.219
0.0%
jan 1, 1973
3.896
-4.323
-52.6%
jan 1, 1974
5.0
+1.104
28.33%
jan 1, 1975
7.5
+2.5
50.0%
jan 1, 1976
12.745
+5.245
69.93%
jan 1, 1977
12.903
+0.158
1.24%
jan 1, 1978
12.03
-0.873
-6.77%
jan 1, 1979
11.888
-0.142
-1.18%
jan 1, 1980
14.286
+2.398
20.17%
jan 1, 1981
14.97
+0.684
4.79%
jan 1, 1982
15.429
+0.459
3.06%
jan 1, 1983
14.894
-0.535
-3.47%
jan 1, 1984
13.725
-1.168
-7.84%
jan 1, 1985
14.486
+0.76
5.54%
jan 1, 1986
15.966
+1.48
10.22%
jan 1, 1987
16.957
+0.99
6.2%
jan 1, 1988
17.105
+0.149
0.88%
jan 1, 1989
16.867
-0.238
-1.39%
jan 1, 1990
24.632
+7.765
46.03%
jan 1, 1991
26.136
+1.504
6.11%
jan 1, 1992
27.984
+1.847
7.07%
jan 1, 1993
23.348
-4.636
-16.57%
jan 1, 1994
22.727
-0.621
-2.66%
jan 1, 1995
24.314
+1.586
6.98%
jan 1, 1996
23.171
-1.143
-4.7%
jan 1, 1997
21.721
-1.449
-6.26%
jan 1, 1998
21.79
+0.069
0.32%
jan 1, 1999
22.761
+0.971
4.46%
jan 1, 2000
22.917
+0.155
0.68%
jan 1, 2001
25.09
+2.173
9.48%
jan 1, 2002
22.14
-2.949
-11.76%
jan 1, 2003
18.276
-3.864
-17.45%
jan 1, 2004
19.128
+0.852
4.66%
jan 1, 2005
17.94
-1.187
-6.21%
jan 1, 2006
16.382
-1.558
-8.68%
jan 1, 2007
12.862
-3.521
-21.49%
jan 1, 2008
9.223
-3.638
-28.29%
jan 1, 2009
8.431
-0.792
-8.59%
jan 1, 2010
7.484
-0.947
-11.23%
jan 1, 2011
7.129
-0.356
-4.75%
jan 1, 2012
7.298
+0.169
2.37%
jan 1, 2013
7.116
-0.182
-2.49%
jan 1, 2014
6.61
-0.506
-7.11%
Ranking of countries by current statistics by years


Comments: