29
/
en
AIzaSyAYiBZKx7MnpbEhh9jyipgxe19OcubqV5w
April 1, 2024
31386
Europe & Central Asia (excluding high income)
ECA
false
2
1
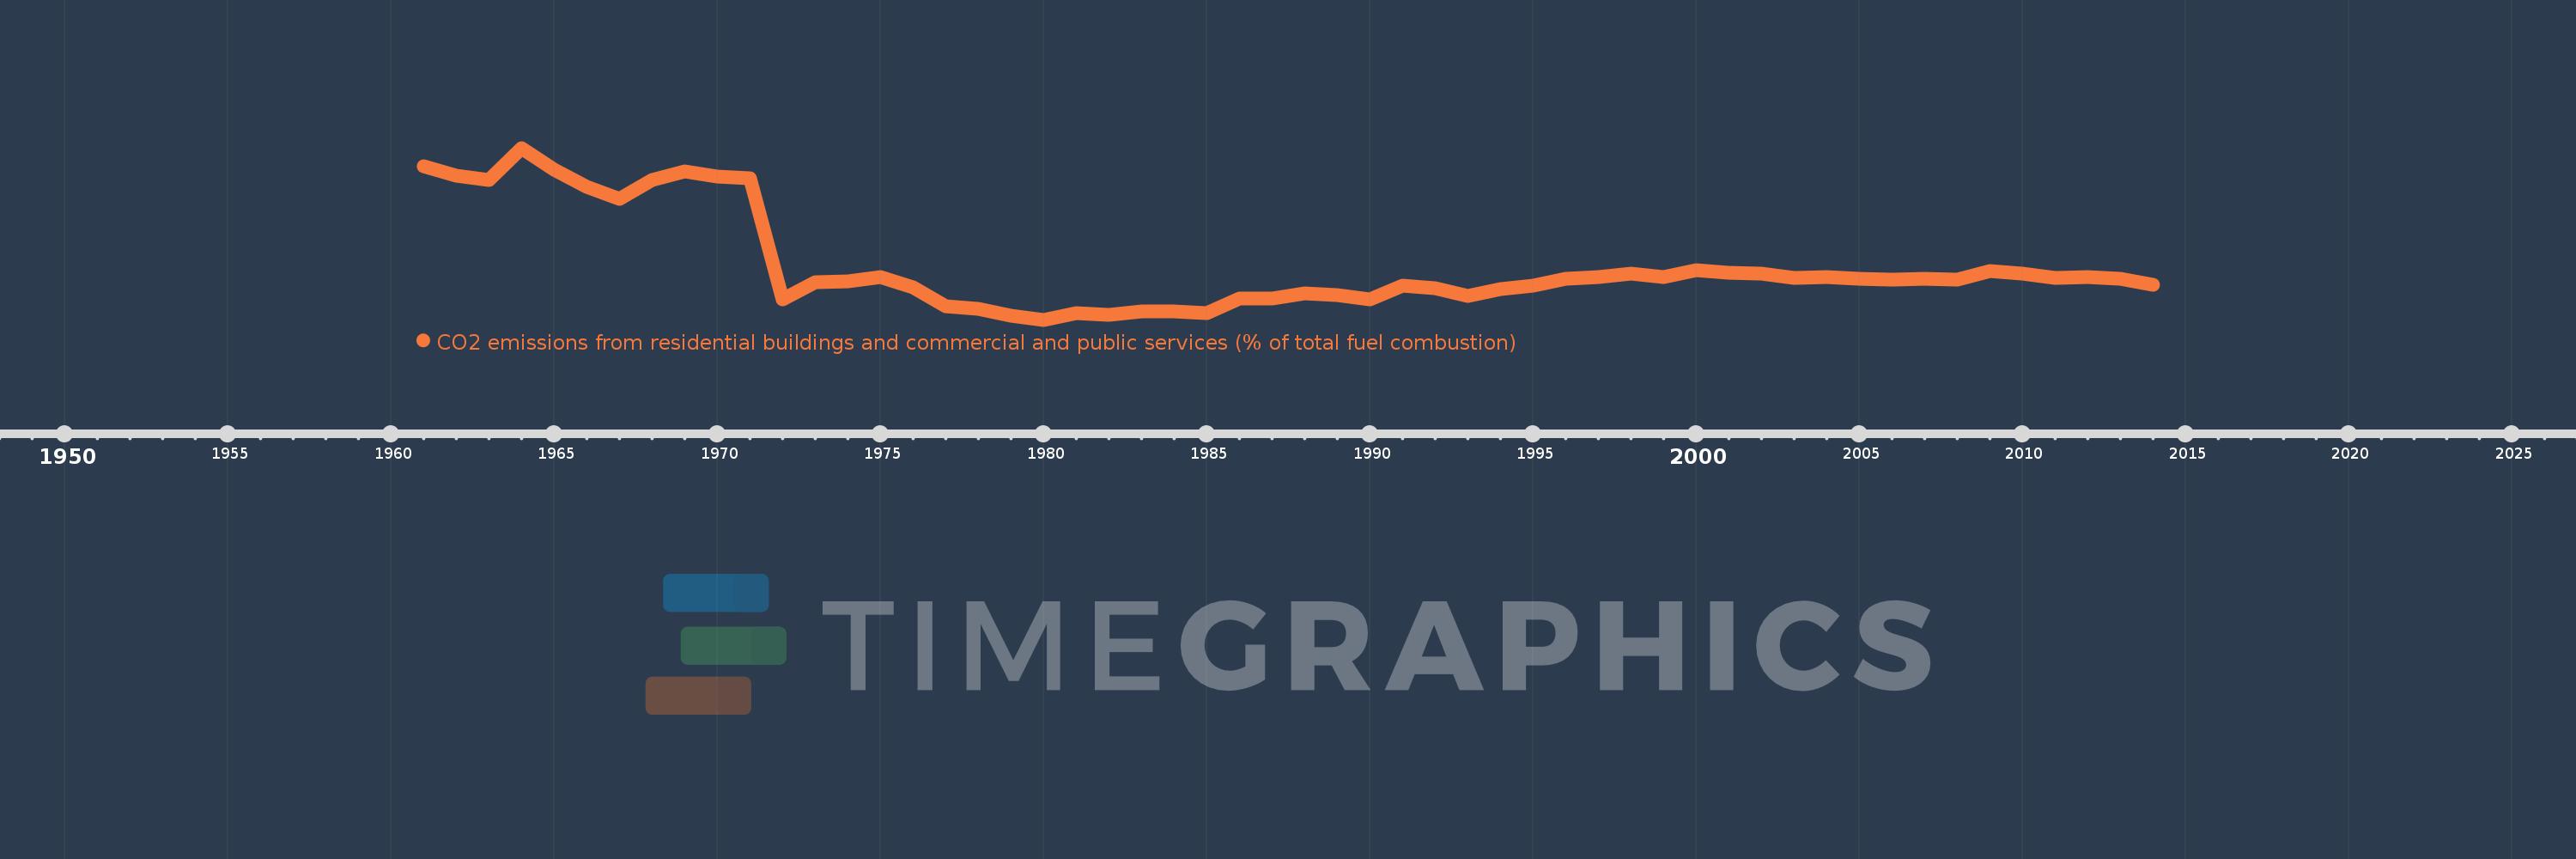
CO2 emissions from residential buildings and commercial and public services (% of total fuel combustion)
2014,2013,2012,2011,2010,2009,2008,2007,2006,2005,2004,2003,2002,2001,2000,1999,1998,1997,1996,1995,1994,1993,1992,1991,1990,1989,1988,1987,1986,1985,1984,1983,1982,1981,1980,1979,1978,1977,1976,1975,1974,1973,1972,1971,1970,1969,1968,1967,1966,1965,1964,1963,1962,1961
This statistics in other country:
AlbaniaAlgeriaAngolaArab WorldArgentinaArmeniaAustraliaAustriaAzerbaijanBahrainBangladeshBelarusBelgiumBeninBoliviaBosnia and HerzegovinaBotswanaBrazilBrunei DarussalamBulgariaCambodiaCameroonCanadaCaribbean small statesCentral Europe and the BalticsChileChinaColombiaCongo, Dem. Rep.Congo, Rep.Costa RicaCote d'IvoireCroatiaCubaCuracaoCyprusCzech RepublicDenmarkDominican RepublicEarly-demographic dividendEast Asia & PacificEast Asia & Pacific (excluding high income)East Asia & Pacific (IDA & IBRD countries)EcuadorEgypt, Arab Rep.El SalvadorEritreaEstoniaEthiopiaEuro areaEurope & Central AsiaEurope & Central Asia (excluding high income)Europe & Central Asia (IDA & IBRD countries)European UnionFinlandFragile and conflict affected situationsFranceGabonGeorgiaGermanyGhanaGibraltarGreeceGuatemalaHaitiHeavily indebted poor countries (HIPC)High incomeHondurasHong Kong SAR, ChinaHungaryIBRD onlyIcelandIDA & IBRD totalIDA blendIDA onlyIDA totalIndiaIndonesiaIran, Islamic Rep.IraqIrelandIsraelItalyJamaicaJapanJordanKazakhstanKenyaKorea, Dem. People’s Rep.Korea, Rep.KosovoKuwaitKyrgyz RepublicLate-demographic dividendLatin America & Caribbean Latin America & Caribbean (excluding high income)Latin America & the Caribbean (IDA & IBRD countries)LatviaLeast developed countries: UN classificationLebanonLibyaLithuaniaLow & middle incomeLow incomeLower middle incomeLuxembourgMacedonia, FYRMalaysiaMaltaMauritiusMexicoMiddle East & North AfricaMiddle East & North Africa (excluding high income)Middle East & North Africa (IDA & IBRD countries)Middle incomeMoldovaMongoliaMontenegroMoroccoMozambiqueMyanmarNamibiaNepalNetherlandsNew ZealandNicaraguaNigerNigeriaNorth AmericaNorwayOECD membersOmanOther small statesPakistanPanamaParaguayPeruPhilippinesPolandPortugalPost-demographic dividendPre-demographic dividendQatarRomaniaRussian FederationSaudi ArabiaSenegalSerbiaSingaporeSlovak RepublicSloveniaSmall statesSouth AfricaSouth AsiaSouth Asia (IDA & IBRD)South SudanSpainSri LankaSub-Saharan Africa Sub-Saharan Africa (excluding high income)Sub-Saharan Africa (IDA & IBRD countries)SudanSwedenSwitzerlandSyrian Arab RepublicTajikistanTanzaniaThailandTogoTrinidad and TobagoTunisiaTurkeyTurkmenistanUkraineUnited Arab EmiratesUnited KingdomUnited StatesUpper middle incomeUruguayUzbekistanVenezuela, RBVietnamWorldYemen, Rep.ZambiaZimbabwe Timeline:
This timeline shows a graph from 1961 to 2014 of Europe & Central Asia (excluding high income). No data until 1960. Number of actual observations by date: 54.
Source name:
World Development Indicators
Source organization:
IEA Statistics © OECD/IEA 2014 (http://www.iea.org/stats/index.asp), subject to https://www.iea.org/t&c/termsandconditions/
Categories, topics:
Environment
Last updated:
apr 23, 2017
Indicators value changes by year
Maximum:
27.058
jan 1, 1964
At the date of observation
Value
Absolute change
Change from previous value
jan 1, 1961
24.806
+24.806
0.0%
jan 1, 1962
23.705
-1.101
-4.44%
jan 1, 1963
23.206
-0.499
-2.11%
jan 1, 1964
27.058
+3.852
16.6%
jan 1, 1965
24.415
-2.642
-9.77%
jan 1, 1966
22.396
-2.019
-8.27%
jan 1, 1967
20.954
-1.442
-6.44%
jan 1, 1968
23.225
+2.271
10.84%
jan 1, 1969
24.24
+1.014
4.37%
jan 1, 1970
23.603
-0.636
-2.63%
jan 1, 1971
23.378
-0.225
-0.95%
jan 1, 1972
8.783
-14.595
-62.43%
jan 1, 1973
10.867
+2.084
23.73%
jan 1, 1974
10.955
+0.088
0.81%
jan 1, 1975
11.486
+0.531
4.85%
jan 1, 1976
10.318
-1.168
-10.17%
jan 1, 1977
7.962
-2.356
-22.83%
jan 1, 1978
7.698
-0.264
-3.32%
jan 1, 1979
6.813
-0.885
-11.5%
jan 1, 1980
6.366
-0.447
-6.56%
jan 1, 1981
7.149
+0.784
12.31%
jan 1, 1982
6.964
-0.186
-2.6%
jan 1, 1983
7.356
+0.392
5.63%
jan 1, 1984
7.415
+0.06
0.81%
jan 1, 1985
7.126
-0.289
-3.9%
jan 1, 1986
8.914
+1.788
25.08%
jan 1, 1987
8.894
-0.02
-0.22%
jan 1, 1988
9.553
+0.658
7.4%
jan 1, 1989
9.351
-0.202
-2.11%
jan 1, 1990
8.834
-0.517
-5.53%
jan 1, 1991
10.515
+1.68
19.02%
jan 1, 1992
10.19
-0.325
-3.09%
jan 1, 1993
9.184
-1.006
-9.88%
jan 1, 1994
10.079
+0.896
9.75%
jan 1, 1995
10.459
+0.38
3.77%
jan 1, 1996
11.315
+0.856
8.18%
jan 1, 1997
11.496
+0.182
1.6%
jan 1, 1998
11.876
+0.38
3.31%
jan 1, 1999
11.501
-0.376
-3.16%
jan 1, 2000
12.37
+0.869
7.56%
jan 1, 2001
12.033
-0.338
-2.73%
jan 1, 2002
11.937
-0.096
-0.8%
jan 1, 2003
11.429
-0.508
-4.25%
jan 1, 2004
11.499
+0.07
0.61%
jan 1, 2005
11.351
-0.147
-1.28%
jan 1, 2006
11.207
-0.144
-1.27%
jan 1, 2007
11.278
+0.071
0.63%
jan 1, 2008
11.164
-0.113
-1.0%
jan 1, 2009
12.223
+1.058
9.48%
jan 1, 2010
11.926
-0.297
-2.43%
jan 1, 2011
11.416
-0.51
-4.27%
jan 1, 2012
11.503
+0.088
0.77%
jan 1, 2013
11.287
-0.216
-1.88%
jan 1, 2014
10.606
-0.681
-6.03%
Ranking of countries by current statistics by years


Comments: