29
/
en
AIzaSyAYiBZKx7MnpbEhh9jyipgxe19OcubqV5w
April 1, 2024
282034
Vietnam
VNM
true
2
1
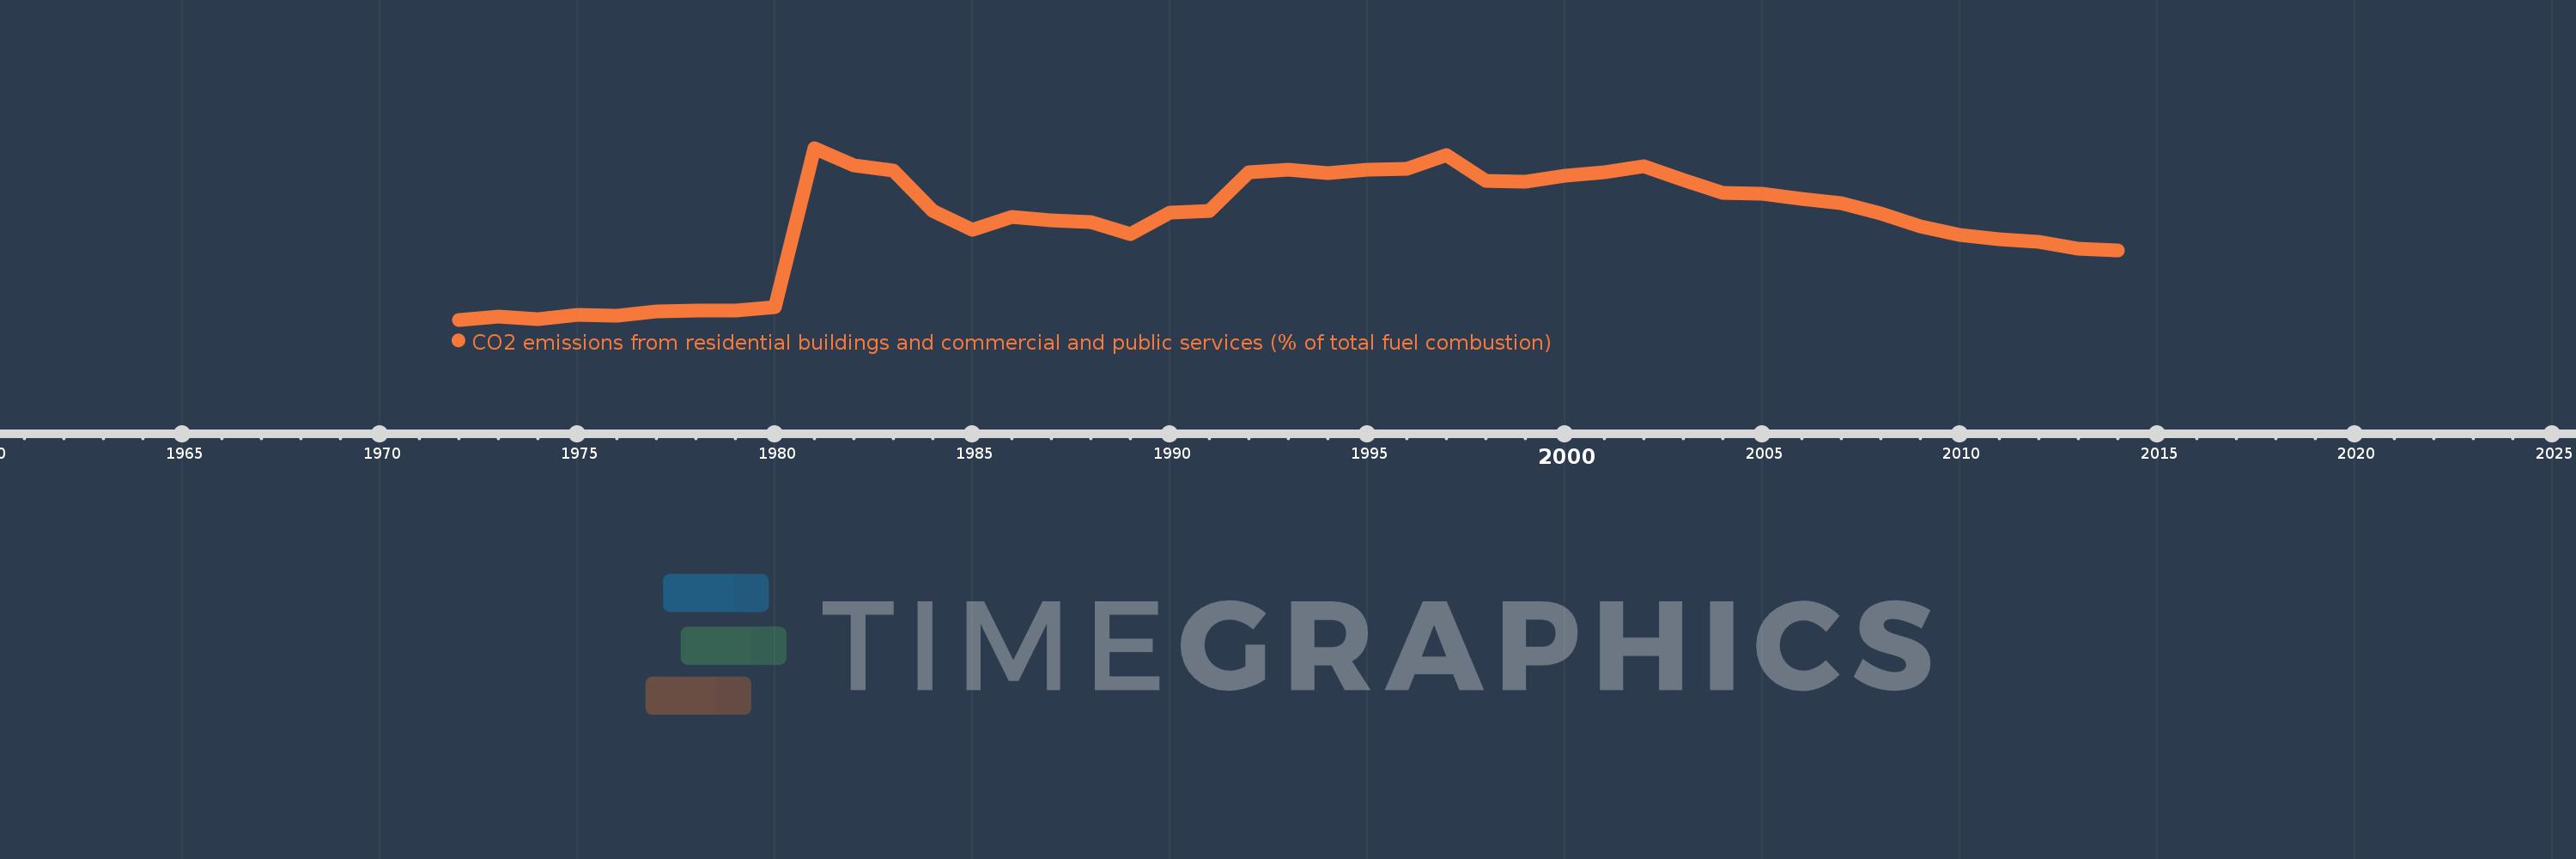
CO2 emissions from residential buildings and commercial and public services (% of total fuel combustion)
2014,2013,2012,2011,2010,2009,2008,2007,2006,2005,2004,2003,2002,2001,2000,1999,1998,1997,1996,1995,1994,1993,1992,1991,1990,1989,1988,1987,1986,1985,1984,1983,1982,1981,1980,1979,1978,1977,1976,1975,1974,1973,1972
This statistics in other country:
AlbaniaAlgeriaAngolaArab WorldArgentinaArmeniaAustraliaAustriaAzerbaijanBahrainBangladeshBelarusBelgiumBeninBoliviaBosnia and HerzegovinaBotswanaBrazilBrunei DarussalamBulgariaCambodiaCameroonCanadaCaribbean small statesCentral Europe and the BalticsChileChinaColombiaCongo, Dem. Rep.Congo, Rep.Costa RicaCote d'IvoireCroatiaCubaCuracaoCyprusCzech RepublicDenmarkDominican RepublicEarly-demographic dividendEast Asia & PacificEast Asia & Pacific (excluding high income)East Asia & Pacific (IDA & IBRD countries)EcuadorEgypt, Arab Rep.El SalvadorEritreaEstoniaEthiopiaEuro areaEurope & Central AsiaEurope & Central Asia (excluding high income)Europe & Central Asia (IDA & IBRD countries)European UnionFinlandFragile and conflict affected situationsFranceGabonGeorgiaGermanyGhanaGibraltarGreeceGuatemalaHaitiHeavily indebted poor countries (HIPC)High incomeHondurasHong Kong SAR, ChinaHungaryIBRD onlyIcelandIDA & IBRD totalIDA blendIDA onlyIDA totalIndiaIndonesiaIran, Islamic Rep.IraqIrelandIsraelItalyJamaicaJapanJordanKazakhstanKenyaKorea, Dem. People’s Rep.Korea, Rep.KosovoKuwaitKyrgyz RepublicLate-demographic dividendLatin America & Caribbean Latin America & Caribbean (excluding high income)Latin America & the Caribbean (IDA & IBRD countries)LatviaLeast developed countries: UN classificationLebanonLibyaLithuaniaLow & middle incomeLow incomeLower middle incomeLuxembourgMacedonia, FYRMalaysiaMaltaMauritiusMexicoMiddle East & North AfricaMiddle East & North Africa (excluding high income)Middle East & North Africa (IDA & IBRD countries)Middle incomeMoldovaMongoliaMontenegroMoroccoMozambiqueMyanmarNamibiaNepalNetherlandsNew ZealandNicaraguaNigerNigeriaNorth AmericaNorwayOECD membersOmanOther small statesPakistanPanamaParaguayPeruPhilippinesPolandPortugalPost-demographic dividendPre-demographic dividendQatarRomaniaRussian FederationSaudi ArabiaSenegalSerbiaSingaporeSlovak RepublicSloveniaSmall statesSouth AfricaSouth AsiaSouth Asia (IDA & IBRD)South SudanSpainSri LankaSub-Saharan Africa Sub-Saharan Africa (excluding high income)Sub-Saharan Africa (IDA & IBRD countries)SudanSwedenSwitzerlandSyrian Arab RepublicTajikistanTanzaniaThailandTogoTrinidad and TobagoTunisiaTurkeyTurkmenistanUkraineUnited Arab EmiratesUnited KingdomUnited StatesUpper middle incomeUruguayUzbekistanVenezuela, RBVietnamWorldYemen, Rep.ZambiaZimbabwe Timeline:
This timeline shows a graph from 1972 to 2014 of Vietnam. No data until 1971. Number of actual observations by date: 43.
Source name:
World Development Indicators
Source organization:
IEA Statistics © OECD/IEA 2014 (http://www.iea.org/stats/index.asp), subject to https://www.iea.org/t&c/termsandconditions/
Categories, topics:
Environment
Last updated:
apr 23, 2017
Indicators value changes by year
Maximum:
17.248
jan 1, 1981
At the date of observation
Value
Absolute change
Change from previous value
jan 1, 1972
1.044
+1.044
0.0%
jan 1, 1973
1.321
+0.277
26.56%
jan 1, 1974
1.137
-0.184
-13.91%
jan 1, 1975
1.527
+0.39
34.27%
jan 1, 1976
1.416
-0.111
-7.26%
jan 1, 1977
1.869
+0.453
32.01%
jan 1, 1978
1.884
+0.015
0.78%
jan 1, 1979
1.94
+0.056
3.0%
jan 1, 1980
2.257
+0.316
16.31%
jan 1, 1981
17.248
+14.992
664.32%
jan 1, 1982
15.576
-1.672
-9.7%
jan 1, 1983
15.085
-0.491
-3.15%
jan 1, 1984
11.321
-3.764
-24.95%
jan 1, 1985
9.499
-1.822
-16.09%
jan 1, 1986
10.729
+1.229
12.94%
jan 1, 1987
10.413
-0.315
-2.94%
jan 1, 1988
10.287
-0.126
-1.21%
jan 1, 1989
9.139
-1.149
-11.16%
jan 1, 1990
11.18
+2.042
22.34%
jan 1, 1991
11.335
+0.154
1.38%
jan 1, 1992
14.988
+3.653
32.23%
jan 1, 1993
15.215
+0.227
1.51%
jan 1, 1994
14.874
-0.34
-2.24%
jan 1, 1995
15.207
+0.333
2.24%
jan 1, 1996
15.264
+0.057
0.37%
jan 1, 1997
16.543
+1.278
8.38%
jan 1, 1998
14.125
-2.418
-14.62%
jan 1, 1999
14.026
-0.098
-0.7%
jan 1, 2000
14.651
+0.625
4.45%
jan 1, 2001
14.925
+0.274
1.87%
jan 1, 2002
15.515
+0.59
3.95%
jan 1, 2003
14.238
-1.277
-8.23%
jan 1, 2004
13.035
-1.203
-8.45%
jan 1, 2005
12.936
-0.099
-0.76%
jan 1, 2006
12.479
-0.456
-3.53%
jan 1, 2007
12.038
-0.442
-3.54%
jan 1, 2008
11.081
-0.956
-7.95%
jan 1, 2009
9.856
-1.225
-11.05%
jan 1, 2010
9.041
-0.815
-8.27%
jan 1, 2011
8.621
-0.42
-4.65%
jan 1, 2012
8.393
-0.228
-2.64%
jan 1, 2013
7.745
-0.648
-7.72%
jan 1, 2014
7.566
-0.179
-2.31%
Ranking of countries by current statistics by years


Comments: