29
/
en
AIzaSyAYiBZKx7MnpbEhh9jyipgxe19OcubqV5w
April 1, 2024
220579
Paraguay
PRY
true
2
1
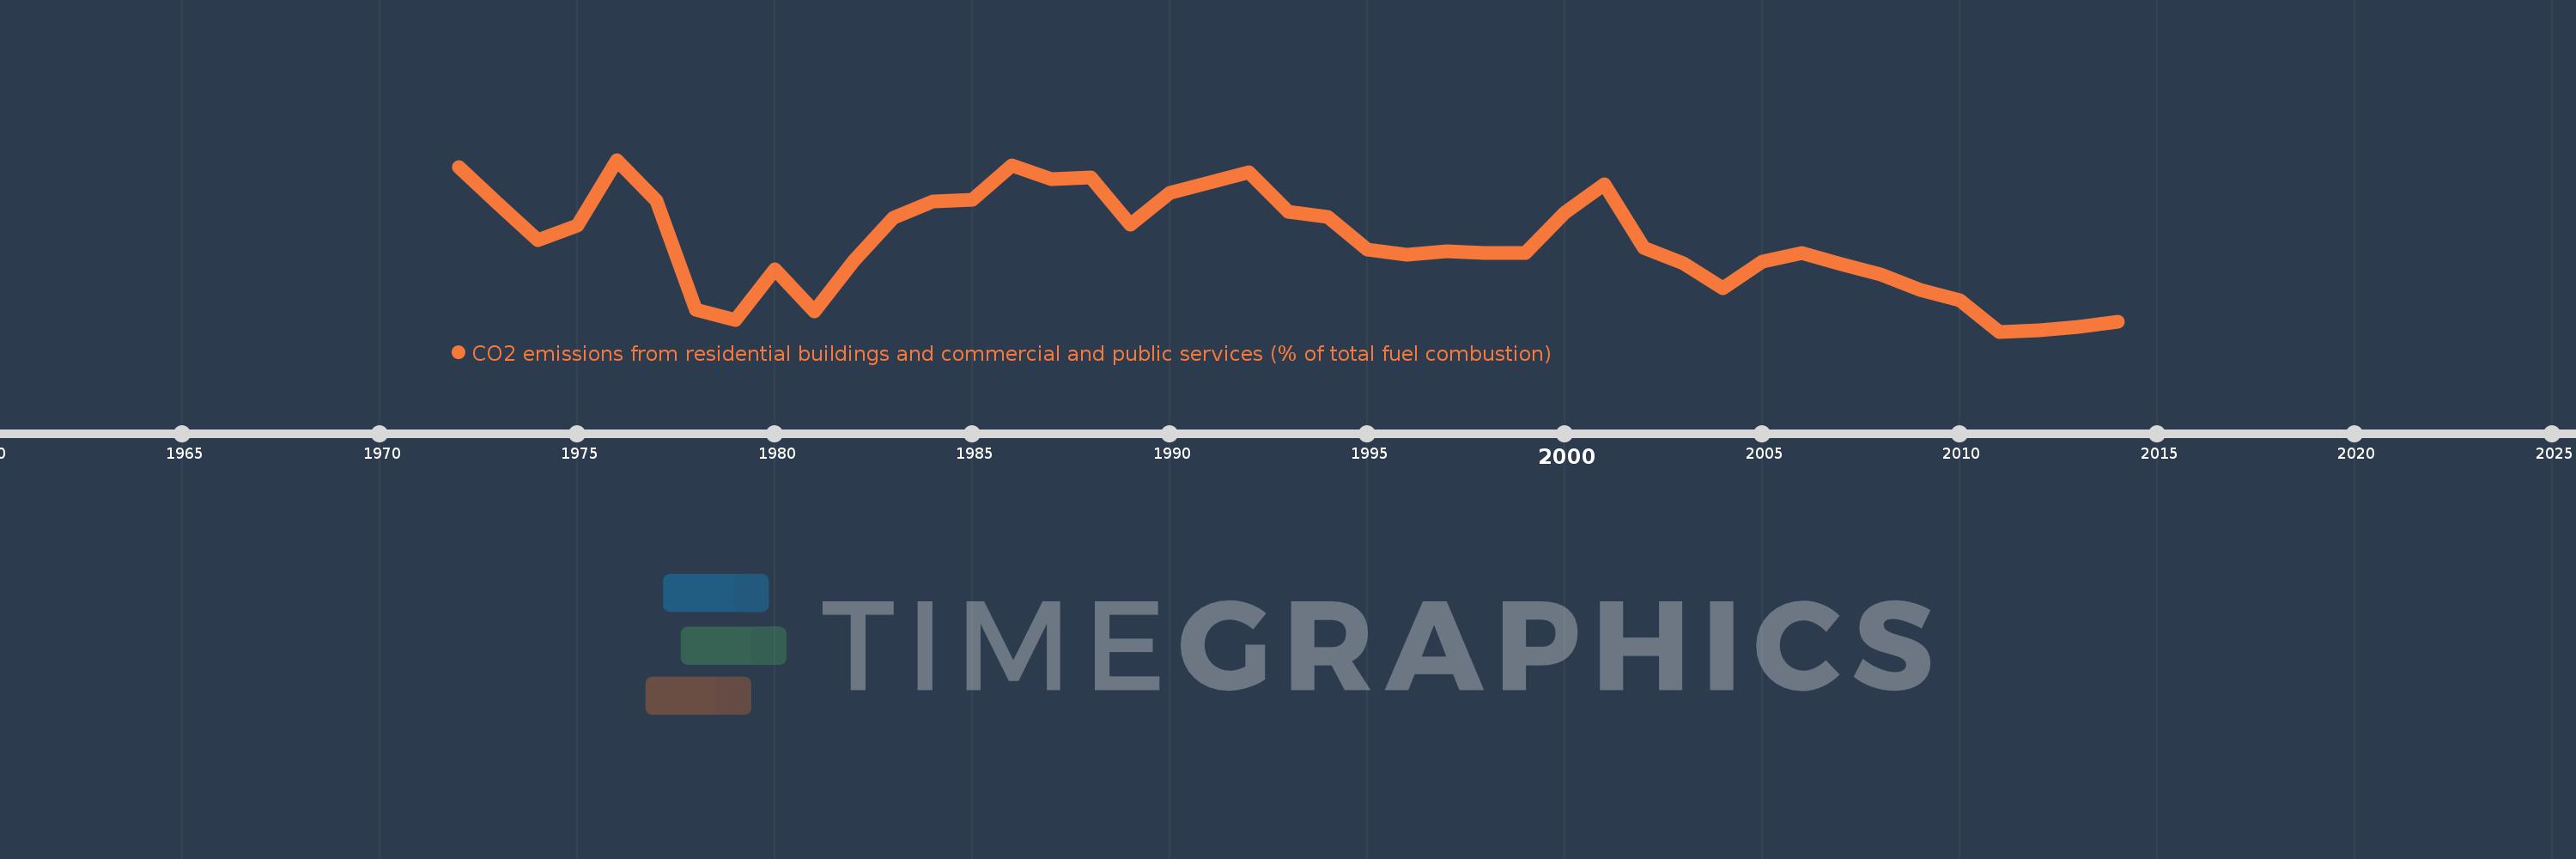
CO2 emissions from residential buildings and commercial and public services (% of total fuel combustion)
2014,2013,2012,2011,2010,2009,2008,2007,2006,2005,2004,2003,2002,2001,2000,1999,1998,1997,1996,1995,1994,1993,1992,1991,1990,1989,1988,1987,1986,1985,1984,1983,1982,1981,1980,1979,1978,1977,1976,1975,1974,1973,1972
This statistics in other country:
AlbaniaAlgeriaAngolaArab WorldArgentinaArmeniaAustraliaAustriaAzerbaijanBahrainBangladeshBelarusBelgiumBeninBoliviaBosnia and HerzegovinaBotswanaBrazilBrunei DarussalamBulgariaCambodiaCameroonCanadaCaribbean small statesCentral Europe and the BalticsChileChinaColombiaCongo, Dem. Rep.Congo, Rep.Costa RicaCote d'IvoireCroatiaCubaCuracaoCyprusCzech RepublicDenmarkDominican RepublicEarly-demographic dividendEast Asia & PacificEast Asia & Pacific (excluding high income)East Asia & Pacific (IDA & IBRD countries)EcuadorEgypt, Arab Rep.El SalvadorEritreaEstoniaEthiopiaEuro areaEurope & Central AsiaEurope & Central Asia (excluding high income)Europe & Central Asia (IDA & IBRD countries)European UnionFinlandFragile and conflict affected situationsFranceGabonGeorgiaGermanyGhanaGibraltarGreeceGuatemalaHaitiHeavily indebted poor countries (HIPC)High incomeHondurasHong Kong SAR, ChinaHungaryIBRD onlyIcelandIDA & IBRD totalIDA blendIDA onlyIDA totalIndiaIndonesiaIran, Islamic Rep.IraqIrelandIsraelItalyJamaicaJapanJordanKazakhstanKenyaKorea, Dem. People’s Rep.Korea, Rep.KosovoKuwaitKyrgyz RepublicLate-demographic dividendLatin America & Caribbean Latin America & Caribbean (excluding high income)Latin America & the Caribbean (IDA & IBRD countries)LatviaLeast developed countries: UN classificationLebanonLibyaLithuaniaLow & middle incomeLow incomeLower middle incomeLuxembourgMacedonia, FYRMalaysiaMaltaMauritiusMexicoMiddle East & North AfricaMiddle East & North Africa (excluding high income)Middle East & North Africa (IDA & IBRD countries)Middle incomeMoldovaMongoliaMontenegroMoroccoMozambiqueMyanmarNamibiaNepalNetherlandsNew ZealandNicaraguaNigerNigeriaNorth AmericaNorwayOECD membersOmanOther small statesPakistanPanamaParaguayPeruPhilippinesPolandPortugalPost-demographic dividendPre-demographic dividendQatarRomaniaRussian FederationSaudi ArabiaSenegalSerbiaSingaporeSlovak RepublicSloveniaSmall statesSouth AfricaSouth AsiaSouth Asia (IDA & IBRD)South SudanSpainSri LankaSub-Saharan Africa Sub-Saharan Africa (excluding high income)Sub-Saharan Africa (IDA & IBRD countries)SudanSwedenSwitzerlandSyrian Arab RepublicTajikistanTanzaniaThailandTogoTrinidad and TobagoTunisiaTurkeyTurkmenistanUkraineUnited Arab EmiratesUnited KingdomUnited StatesUpper middle incomeUruguayUzbekistanVenezuela, RBVietnamWorldYemen, Rep.ZambiaZimbabwe Timeline:
This timeline shows a graph from 1972 to 2014 of Paraguay. No data until 1971. Number of actual observations by date: 43.
Source name:
World Development Indicators
Source organization:
IEA Statistics © OECD/IEA 2014 (http://www.iea.org/stats/index.asp), subject to https://www.iea.org/t&c/termsandconditions/
Categories, topics:
Environment
Last updated:
apr 23, 2017
Indicators value changes by year
At the date of observation
Value
Absolute change
Change from previous value
jan 1, 1972
7.018
+7.018
0.0%
jan 1, 1973
6.349
-0.668
-9.52%
jan 1, 1974
5.714
-0.635
-10.0%
jan 1, 1975
5.97
+0.256
4.48%
jan 1, 1976
7.143
+1.173
19.64%
jan 1, 1977
6.41
-0.733
-10.26%
jan 1, 1978
4.464
-1.946
-30.36%
jan 1, 1979
4.286
-0.179
-4.0%
jan 1, 1980
5.185
+0.899
20.99%
jan 1, 1981
4.444
-0.741
-14.29%
jan 1, 1982
5.344
+0.899
20.23%
jan 1, 1983
6.107
+0.763
14.29%
jan 1, 1984
6.4
+0.293
4.8%
jan 1, 1985
6.429
+0.029
0.45%
jan 1, 1986
7.042
+0.614
9.55%
jan 1, 1987
6.803
-0.24
-3.4%
jan 1, 1988
6.832
+0.03
0.43%
jan 1, 1989
5.978
-0.854
-12.5%
jan 1, 1990
6.557
+0.579
9.69%
jan 1, 1991
6.736
+0.178
2.72%
jan 1, 1992
6.915
+0.179
2.66%
jan 1, 1993
6.222
-0.693
-10.02%
jan 1, 1994
6.13
-0.092
-1.48%
jan 1, 1995
5.537
-0.593
-9.67%
jan 1, 1996
5.444
-0.093
-1.69%
jan 1, 1997
5.507
+0.063
1.16%
jan 1, 1998
5.483
-0.024
-0.44%
jan 1, 1999
5.473
-0.01
-0.19%
jan 1, 2000
6.203
+0.731
13.35%
jan 1, 2001
6.707
+0.504
8.12%
jan 1, 2002
5.572
-1.135
-16.93%
jan 1, 2003
5.292
-0.279
-5.01%
jan 1, 2004
4.852
-0.441
-8.33%
jan 1, 2005
5.319
+0.467
9.63%
jan 1, 2006
5.476
+0.156
2.94%
jan 1, 2007
5.278
-0.198
-3.61%
jan 1, 2008
5.094
-0.184
-3.49%
jan 1, 2009
4.822
-0.271
-5.33%
jan 1, 2010
4.634
-0.188
-3.9%
jan 1, 2011
4.077
-0.557
-12.02%
jan 1, 2012
4.107
+0.03
0.72%
jan 1, 2013
4.167
+0.06
1.46%
jan 1, 2014
4.26
+0.093
2.23%
Ranking of countries by current statistics by years


Comments: